Crypto Market Update: Ripple, Dogecoin, and Solana Face Notable Declines
QuoteReporter
•5 min read
Crypto Market Update: Ripple, Dogecoin, and Solana Face Notable Declines
Crypto Market Report | August 24, 2026
📊 Crypto Market Overview
The cryptocurrency market is currently experiencing a slight pullback after a significant rally, with Bitcoin (BTC) trading at $76,887.91, down 1.12% today. This decline follows a remarkable week where Bitcoin surged by 23%, largely driven by favorable sentiment surrounding U.S. debt policy. Ethereum (ETH) is also seeing a minor decrease, trading at $2,438.87, down 1.01%. Both Bitcoin and Ethereum exhibit high Relative Strength Index (RSI) values, indicating that they are in overbought territory, with BTC at 83.3 and ETH at 84.3. The Moving Average Convergence Divergence (MACD) for both assets suggests bullish momentum, although the recent price action may signal a potential consolidation phase.
Ripple (XRP) has faced a more pronounced decline of 4.35%, trading at $1.4559, as it corrects from its recent highs. The asset's RSI stands at 84.0, also indicating overbought conditions. Solana (SOL) and Binance Coin (BNB) are similarly experiencing slight downturns, with SOL at $93.40 and BNB at $693.61, both reflecting strong RSI levels above 83.
In the broader macro context, the cryptocurrency market is buoyed by positive developments such as the launch of a crypto licensing portal in Pakistan and the participation of banks and regulators in a quantum-resistant crypto transfer pilot. However, the market is also facing challenges, as evidenced by the recent $8.5 million exploit of the Term Finance lending app. Overall, while the market sentiment remains optimistic following the recent rallies, the current technical signals suggest a period of consolidation may be on the horizon as traders reassess positions.
Ripple (XRP) has faced a more pronounced decline of 4.35%, trading at $1.4559, as it corrects from its recent highs. The asset's RSI stands at 84.0, also indicating overbought conditions. Solana (SOL) and Binance Coin (BNB) are similarly experiencing slight downturns, with SOL at $93.40 and BNB at $693.61, both reflecting strong RSI levels above 83.
In the broader macro context, the cryptocurrency market is buoyed by positive developments such as the launch of a crypto licensing portal in Pakistan and the participation of banks and regulators in a quantum-resistant crypto transfer pilot. However, the market is also facing challenges, as evidenced by the recent $8.5 million exploit of the Term Finance lending app. Overall, while the market sentiment remains optimistic following the recent rallies, the current technical signals suggest a period of consolidation may be on the horizon as traders reassess positions.
📰 Crypto News
- Here’s what happened in crypto today
- Banks, regulators join quantum-resistant crypto transfer pilot
- Pakistan opens crypto licensing portal, sets Sept. 5 deadline for existing firms
- Term Finance loses estimated $8.5M in vault governance exploit
- We are so back! Bitcoin’s 23% rally on US debt policy: Hodler’s Digest
- Crypto roars back as bitcoin posts its second-best week since early 2021
- Jackson Hole Symposium, U.S. PCE prices, IREN earnings: Crypto Week Ahead
- Live updates: Bitcoin holds $77,000 as XRP, Zcash pull back after a big weekly rally
- Ether is crushing bitcoin and the 'golden cross' says it may not be done yet
- Ethereum lending app Term Finance loses $8.5 million after attacker buys voting power
- Ray Dalio says investors should own ‘a bit of Bitcoin’ as U.S. debt risks rise
- Bessent's $4 billion bond buyback wanted lower yields. It got a bitcoin surge instead.
- Stablecoin neobank Fasset lands $1 billion valuation as SBI backs its payments push
- Crypto holds big weekly rally as Warsh’s Jackson Hole debut comes into focus
🔍 Technical Analysis
Bitcoin (BTC) — -1.12%
$76,887.91 52W: $57,747.77 — $97,860.60
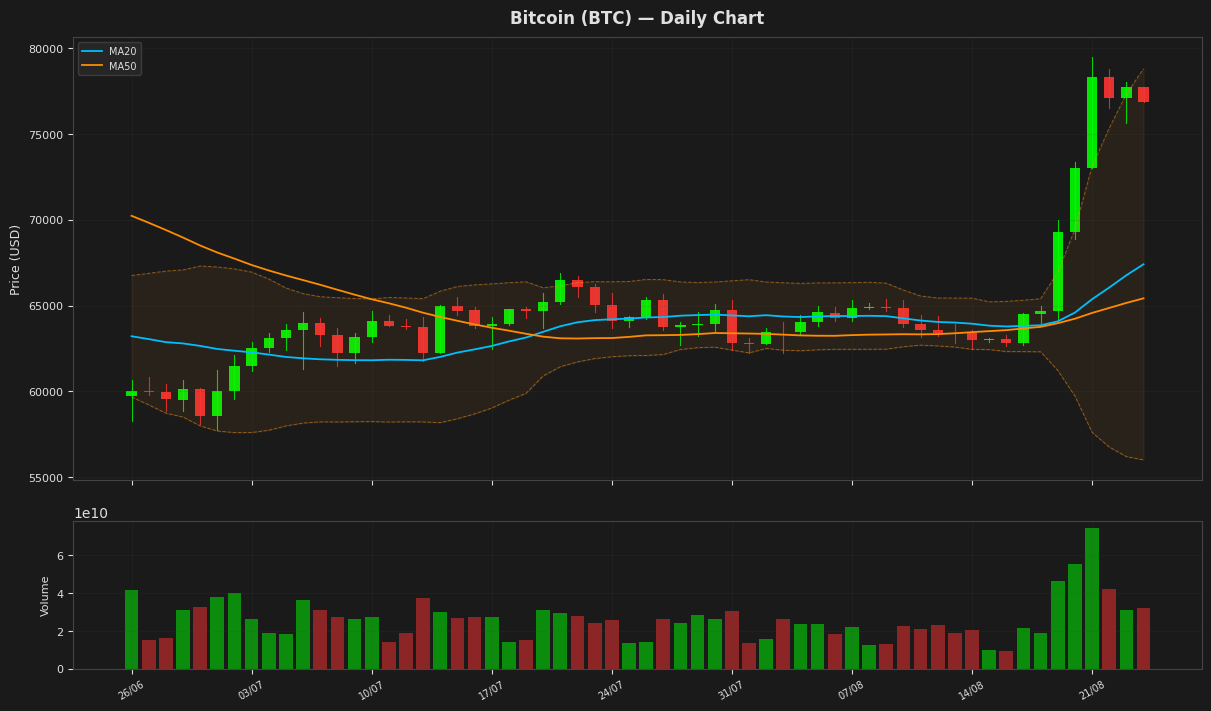
Bitcoin is currently trading at $76,887.91, reflecting a daily decline of 1.12%. The price is significantly above the 20-day and 50-day moving averages of $67,406.13 and $65,421.48, respectively, indicating a strong bullish trend. However, the RSI at 83.28 suggests that Bitcoin is in overbought territory, which may lead to a potential price correction. The Bollinger Bands indicate that Bitcoin is approaching the upper band at $78,803.64, further supporting the possibility of a short-term pullback.
Ethereum (ETH) — -1.01%
$2,438.87 52W: $1,506.51 — $3,397.90
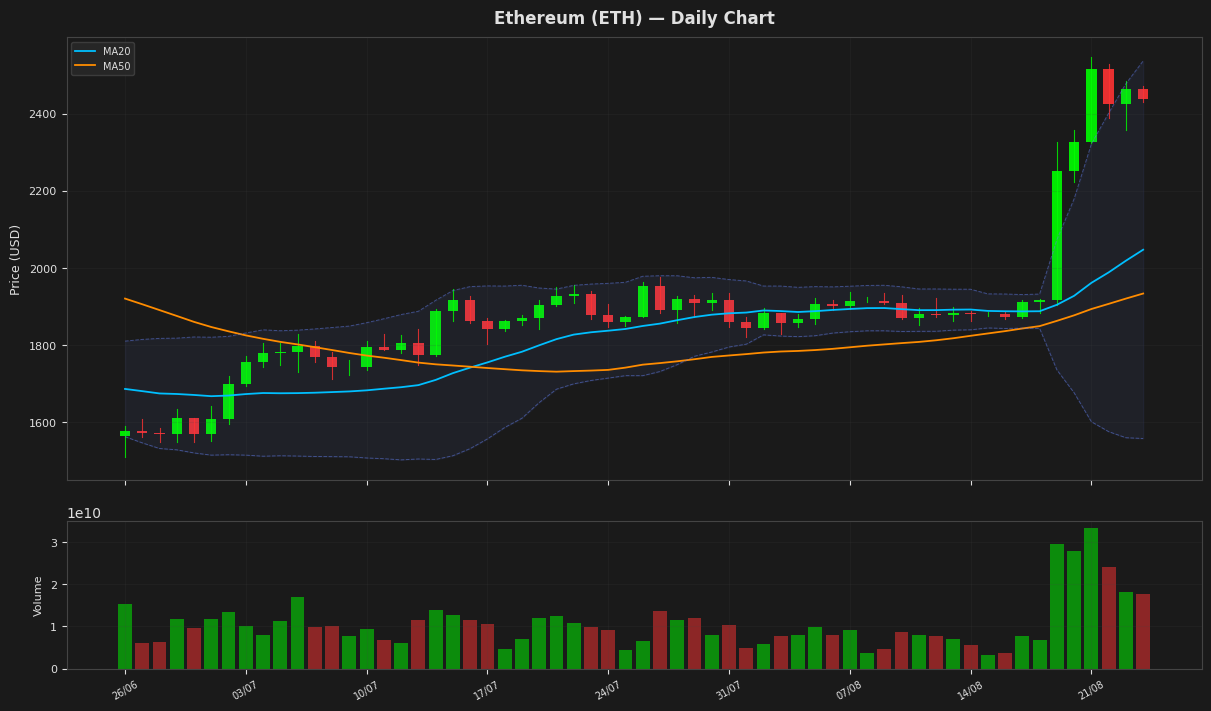
Ethereum is currently trading at $2,438.87, showing a slight daily decline of 1.01%. The price is above both the 20-day and 50-day moving averages, indicating a bullish trend, while the RSI at 84 suggests that ETH is overbought. The Bollinger Bands indicate potential resistance at the upper band of $2,536.64 and support at the lower band of $1,557.87. Overall, while the upward momentum remains strong, caution is advised due to the overbought conditions reflected in the RSI.
Ripple (XRP) — -4.35%
$1.4559 52W: $0.988422 — $2.4103
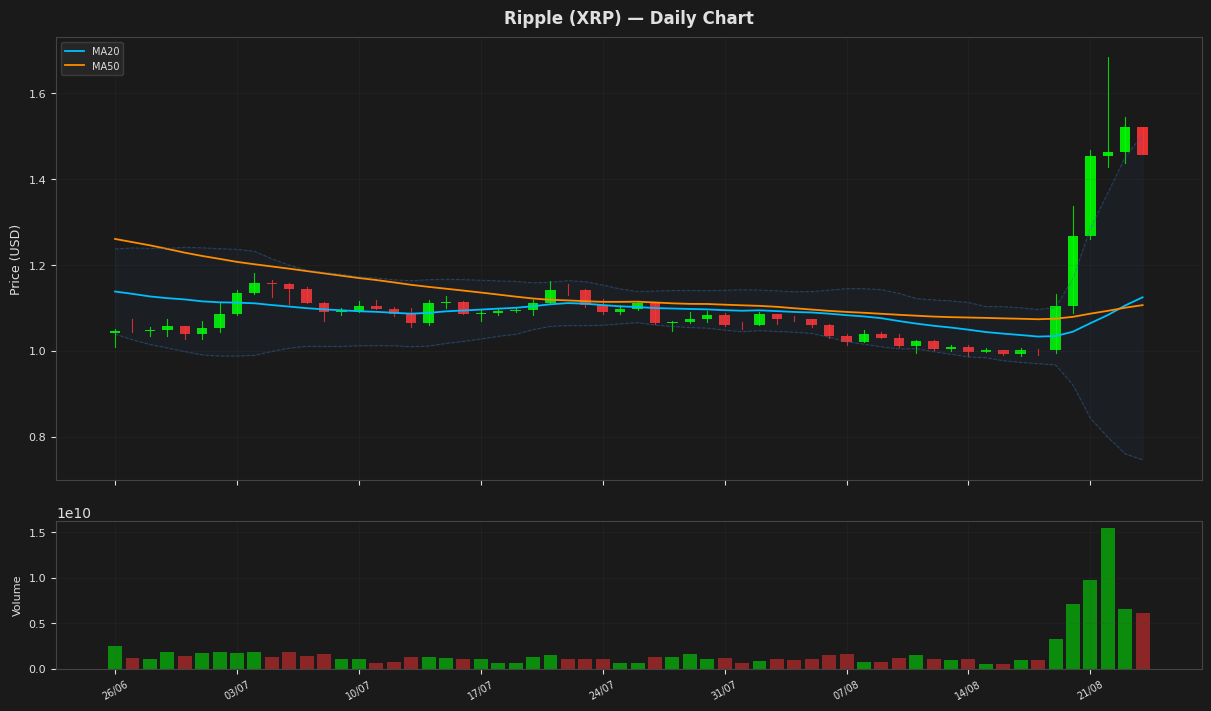
Ripple (XRP) is currently priced at $1.455900, reflecting a daily decline of 4.35%. The price is significantly above both the 20-day and 50-day moving averages, indicating a strong bullish trend; however, the high RSI of 83.998 suggests that XRP may be overbought. The Bollinger Bands indicate potential resistance at the upper band of $1.503597, while the ATR shows relatively low volatility at 0.083173. Overall, XRP appears to be in a corrective phase after recent highs, and traders should watch for potential support near the moving averages.
Solana (SOL) — -2.14%
$93.4000 52W: $60.4147 — $148.2160
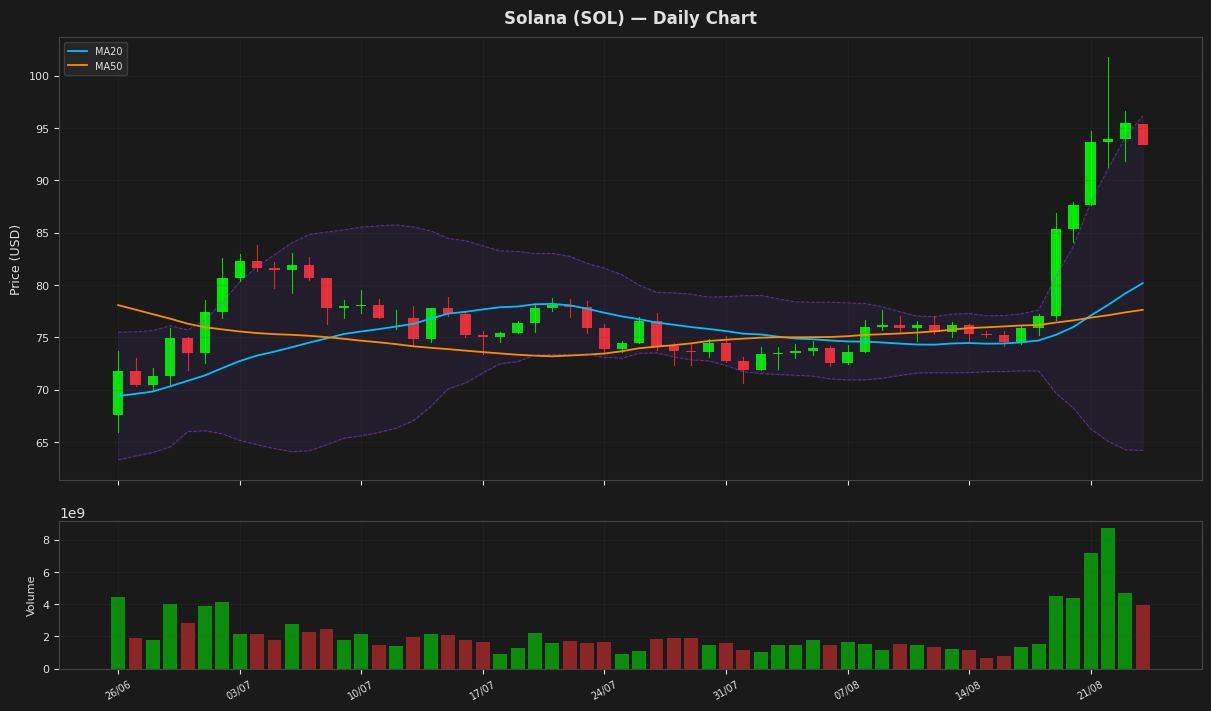
Solana is currently trading at $93.40, reflecting a daily decline of 2.14%. The price is above both the 20-day moving average (MA20) of 80.19 and the 50-day moving average (MA50) of 77.63, indicating a bullish trend. However, the RSI is at 83.37, suggesting that the asset may be overbought, while the MACD shows a positive momentum with a value of 4.75. The Bollinger Bands indicate potential volatility, with the upper band at 96.16 and the lower band at 64.21.
BNB (BNB) — -1.17%
$693.6100 52W: $538.5992 — $954.8583
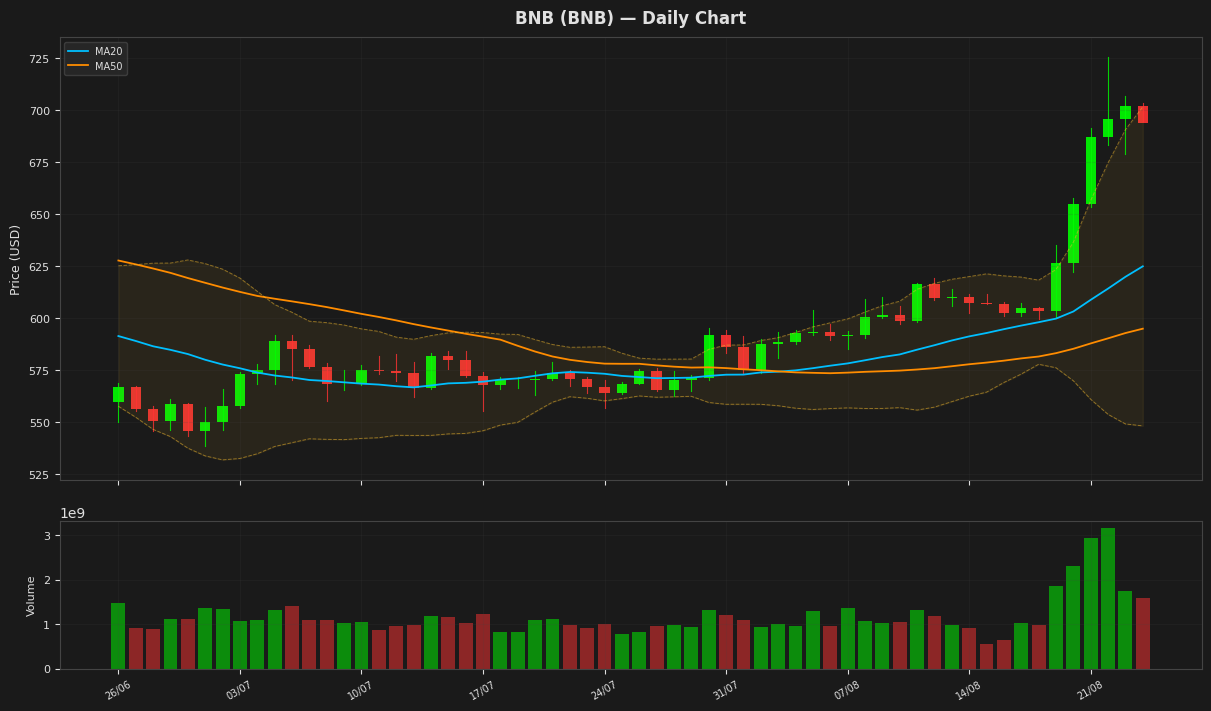
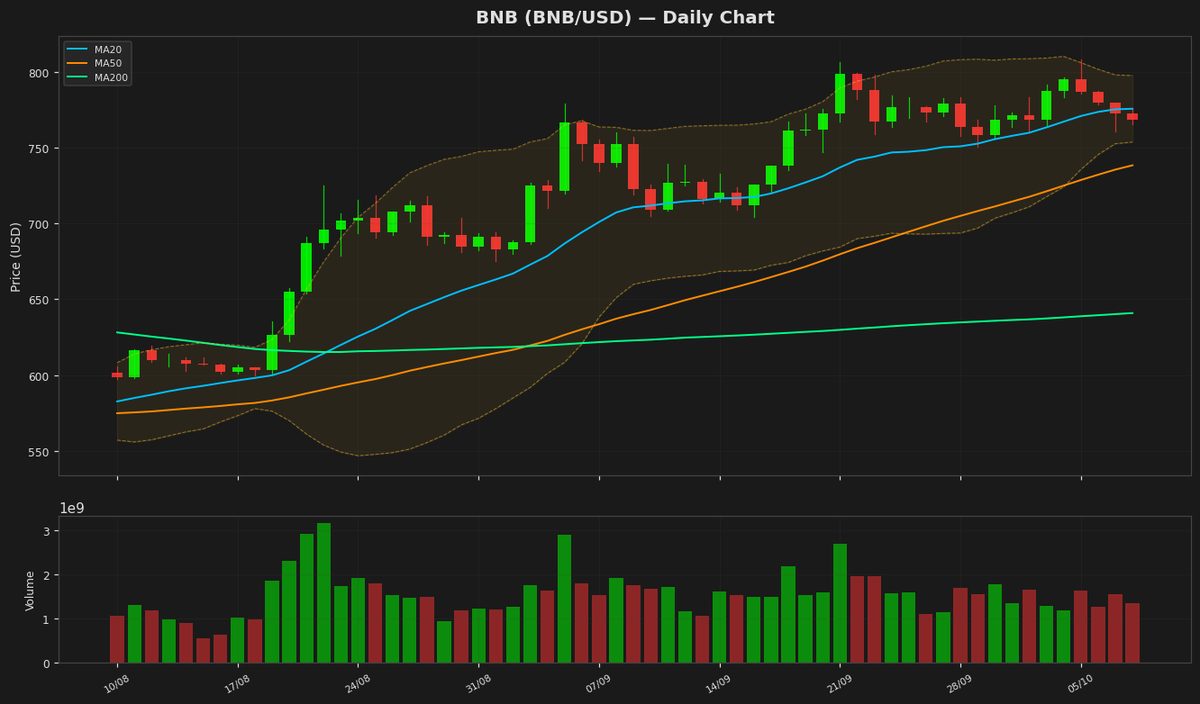
BNB is currently trading at $693.61, reflecting a daily decline of 1.17%. The price is above both the 20-day moving average (MA20) of $624.98 and the 50-day moving average (MA50) of $595.02, indicating a bullish trend. However, with an RSI of 83.09, BNB is in overbought territory, suggesting potential for a pullback. The Bollinger Bands show resistance at $701.61 and support at $548.34, which could define the price range in the near term.
Tron (TRX) — -0.19%
$0.343309 52W: $0.268138 — $0.376332
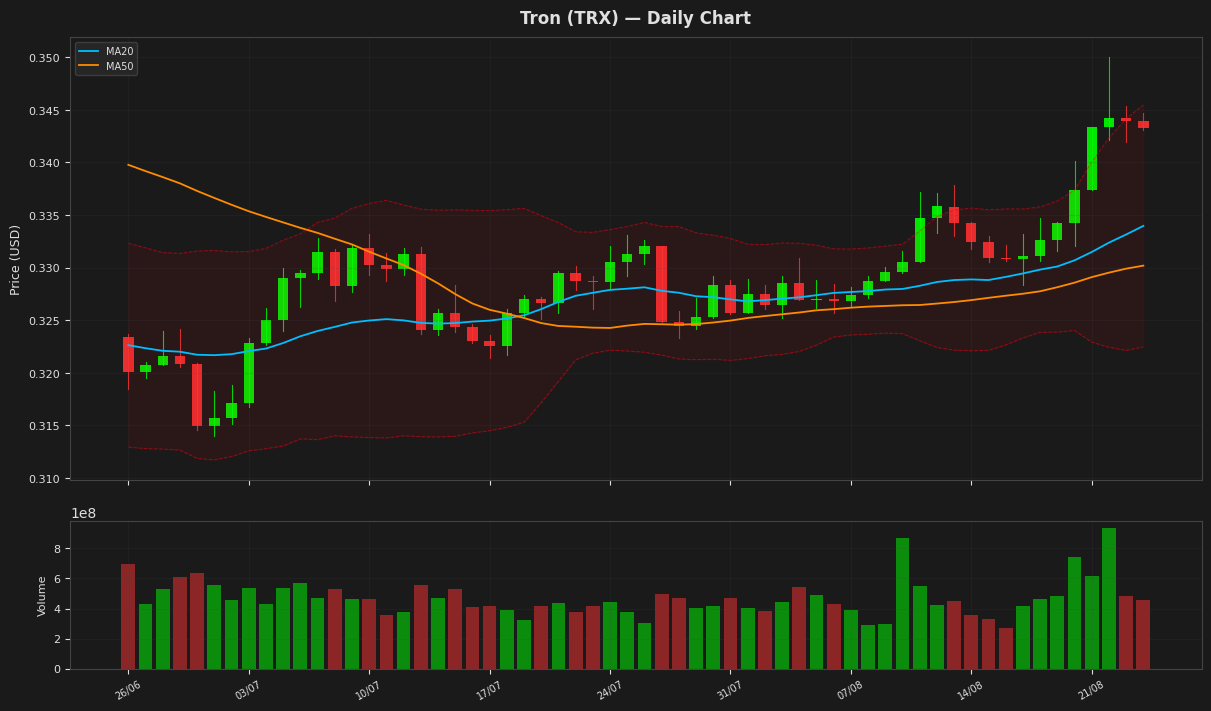
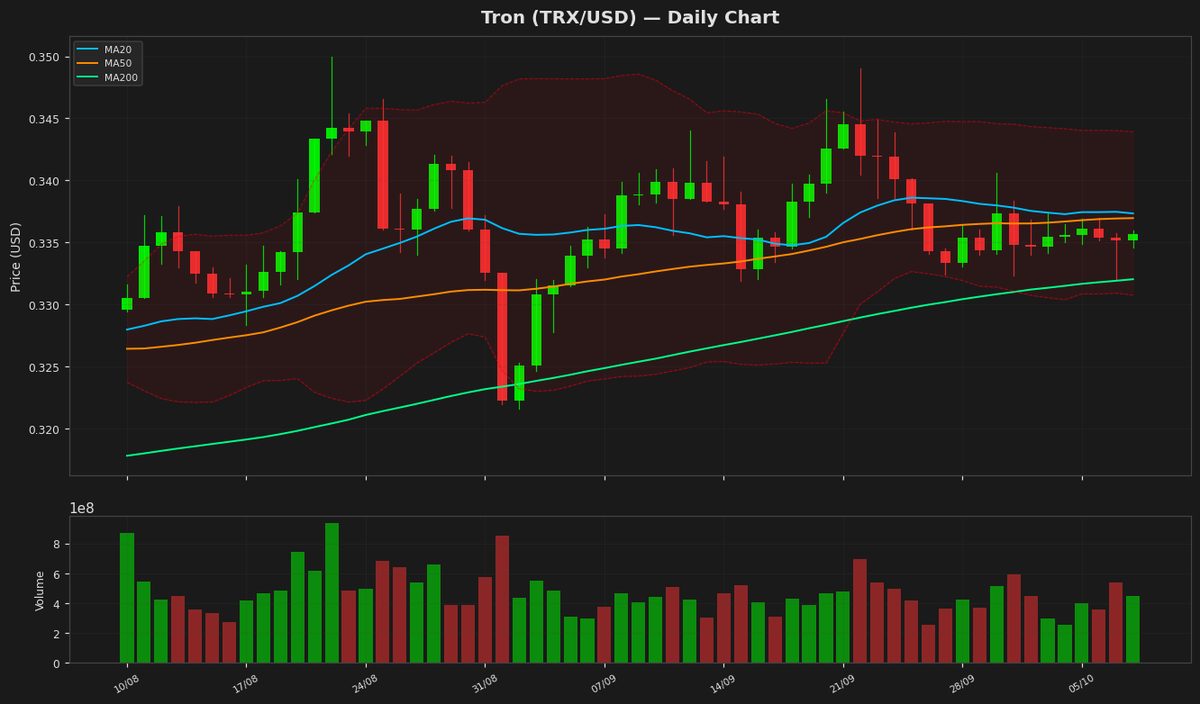
Tron (TRX) is currently trading at $0.343309, reflecting a slight daily decline of 0.19%. The price is above both the 20-day moving average (MA20) of 0.333973 and the 50-day moving average (MA50) of 0.330194, indicating a bullish trend. However, the Relative Strength Index (RSI) at 75.90 suggests that TRX may be overbought, which could lead to a potential correction. The Bollinger Bands indicate resistance at $0.345471 and support at $0.322475, providing critical levels to watch in the near term.
Dogecoin (DOGE) — -3.39%
$0.090250 52W: $0.067973 — $0.156091
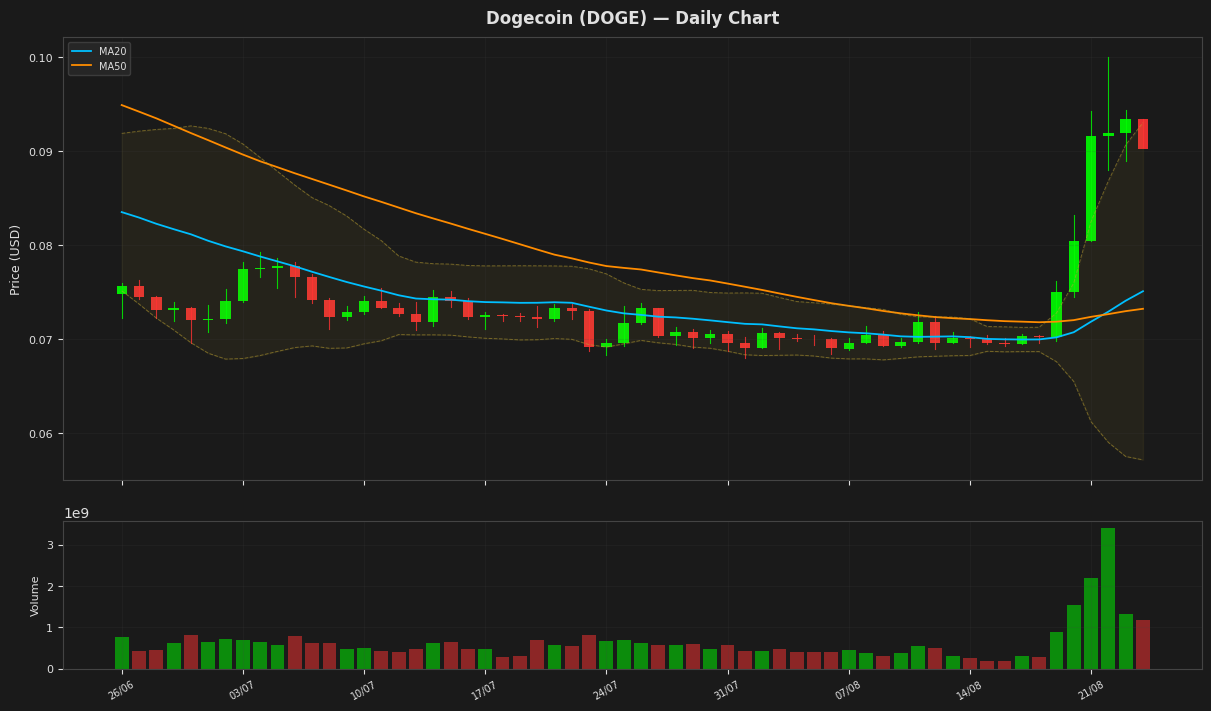
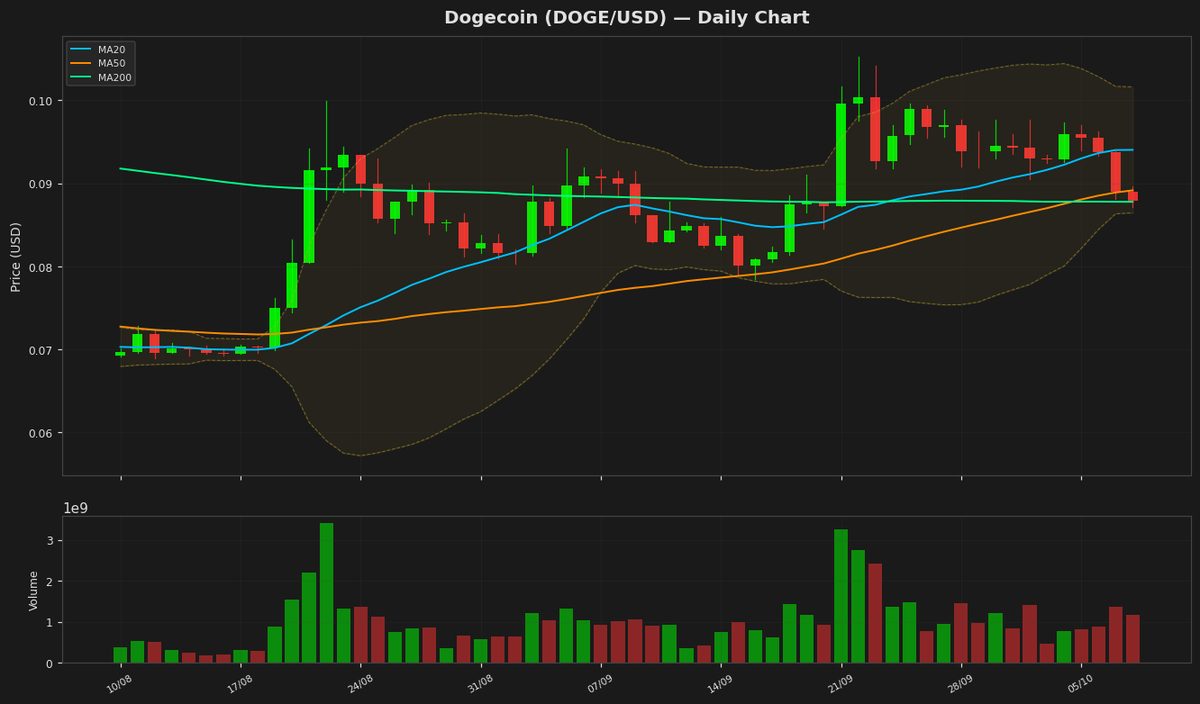
Dogecoin is currently trading at $0.090250, reflecting a daily decline of 3.39%. The price is above both the 20-day and 50-day moving averages, indicating a bullish trend in the short term. However, the RSI is at a high level of 81.29, suggesting that the asset may be overbought, which could lead to potential price corrections. The Bollinger Bands indicate that the price is nearing the upper band at $0.093035, further supporting the possibility of a pullback.
Disclaimer
The content on MarketsFN.com is provided for educational and informational purposes only. It does not constitute financial advice or investment recommendations. All investments involve risk. Past performance does not guarantee future results.