Crypto Market Update: Dogecoin and Solana Lead Minor Gains Today
QuoteReporter
•5 min read
Crypto Market Update: Dogecoin and Solana Lead Minor Gains Today
Crypto Market Report | October 05, 2026
📊 Crypto Market Overview
The cryptocurrency market is currently exhibiting a relatively stable sentiment, with most major assets trading with minimal daily changes. Bitcoin, the market leader, is priced at $86,432, showing a marginal decline of 0.06% over the day. Its RSI stands at 48.9, indicating a neutral stance, while the MACD at 2045.7677 suggests a continued bullish underlying momentum. Other major cryptocurrencies such as Ethereum, Ripple, and BNB are also trading with minor fluctuations, with Ethereum and Ripple showing slight gains.
The macro context is influenced by the recent inflows into Bitcoin ETFs, marking their third consecutive week of positive inflows, while Ether ETFs experienced outflows of $138 million. This divergence in investor sentiment between Bitcoin and Ethereum products is noteworthy. Additionally, the filing by OKX and the NYSE parent company to launch a tokenized US stock platform highlights the growing intersection between traditional financial markets and the cryptocurrency space.
From a technical perspective, Solana's RSI at 57.4 indicates a relatively stronger position compared to other major assets, while Tron's RSI at 28.7 suggests it is currently oversold. The MACD values across the major cryptocurrencies generally indicate a mix of bullish and bearish underlying trends, with Bitcoin, Ethereum, and Solana showing positive MACD values. The overall market is characterized by a mix of technical signals, with some assets indicating potential for growth and others showing signs of consolidation or weakness. The recent news and developments in the crypto regulatory and product landscape are likely to continue shaping market sentiment and influencing the trajectory of various cryptocurrencies.
The macro context is influenced by the recent inflows into Bitcoin ETFs, marking their third consecutive week of positive inflows, while Ether ETFs experienced outflows of $138 million. This divergence in investor sentiment between Bitcoin and Ethereum products is noteworthy. Additionally, the filing by OKX and the NYSE parent company to launch a tokenized US stock platform highlights the growing intersection between traditional financial markets and the cryptocurrency space.
From a technical perspective, Solana's RSI at 57.4 indicates a relatively stronger position compared to other major assets, while Tron's RSI at 28.7 suggests it is currently oversold. The MACD values across the major cryptocurrencies generally indicate a mix of bullish and bearish underlying trends, with Bitcoin, Ethereum, and Solana showing positive MACD values. The overall market is characterized by a mix of technical signals, with some assets indicating potential for growth and others showing signs of consolidation or weakness. The recent news and developments in the crypto regulatory and product landscape are likely to continue shaping market sentiment and influencing the trajectory of various cryptocurrencies.
📰 Crypto News
- Bitcoin ETFs notch third inflow week as Ether ETFs shed $138M
- Here’s what happened in crypto today
- Zcash activates NU7 on testnet ahead of November mainnet target
- OKX, NYSE parent file to launch tokenized US stock platform
- Safe investor asks Swiss watchdog to intervene in governance dispute
- Zcash gets a Washington lobbyist to push crypto policy
- Former SEC boss made AI Czar, Bitcoin may hit $600K this cycle: Hodler’s Digest
- Bitcoin is about to get a major bullish signal it hasn't had in over a year
- Ethereum investors are stuck in a two-week staking exit line. Here's why.
- Joint venture of OKX and NYSE parent ICE files for 24/7 tokenized U.S. stock trading
- Zcash’s 25-second blocks go live on public testnet ahead of schedule
- Bitcoin zooms toward $87,000, nearly setting an eight-month high, then reverses
- Ether's bitcoin-beating Q3 rally came with a catch. Liquidity thinned.
🔍 Technical Analysis
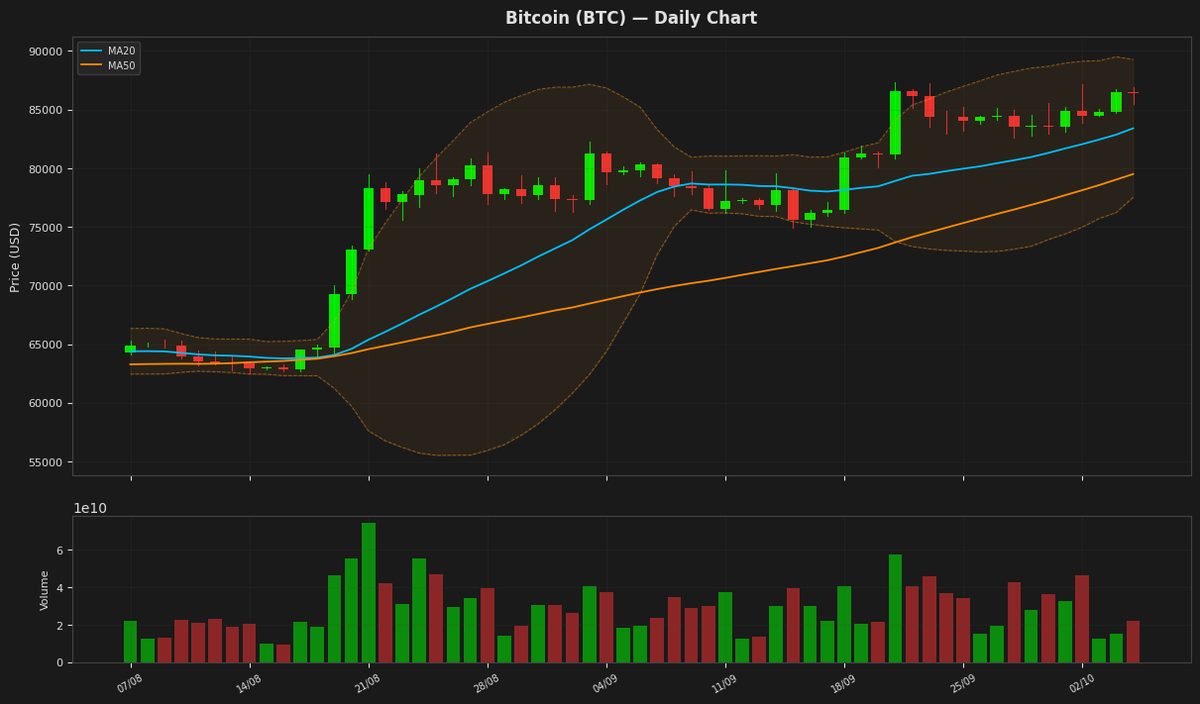
Bitcoin (BTC) — -0.06%
$86,432.24 52W: $57,747.77 — $90,439.29
Bitcoin is currently trading at $86,432, near the middle of its Bollinger Bands, indicating a lack of clear direction. The RSI is at 48.91, suggesting a neutral market sentiment. The MACD is below its signal line, indicating a potential bearish signal, while the ATR remains relatively high, indicating continued market volatility. The price is above both MA20 and MA50, indicating a maintained uptrend.
Ethereum (ETH) — +0.03%
$2,727.20 52W: $1,506.51 — $3,040.72
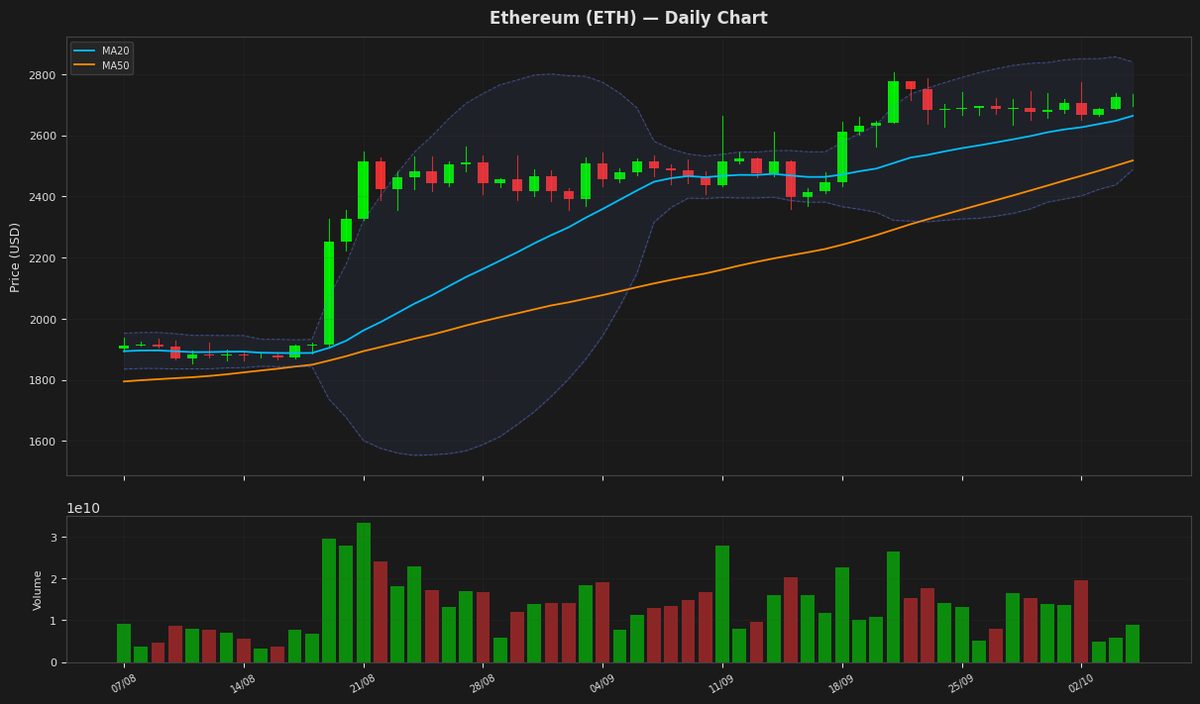
Ethereum's price is currently at $2,727, showing a minimal daily change, and is positioned between the upper and lower Bollinger Bands, indicating a relatively stable trend. The RSI is at 40.13, suggesting that the asset is nearing oversold territory. The MACD is below its signal line, indicating a potential bearish signal. The price is also below both the MA20 and the upper Bollinger Band, indicating a lack of strong upward momentum.
Ripple (XRP) — +0.03%
$1.5206 52W: $0.988422 — $1.9382
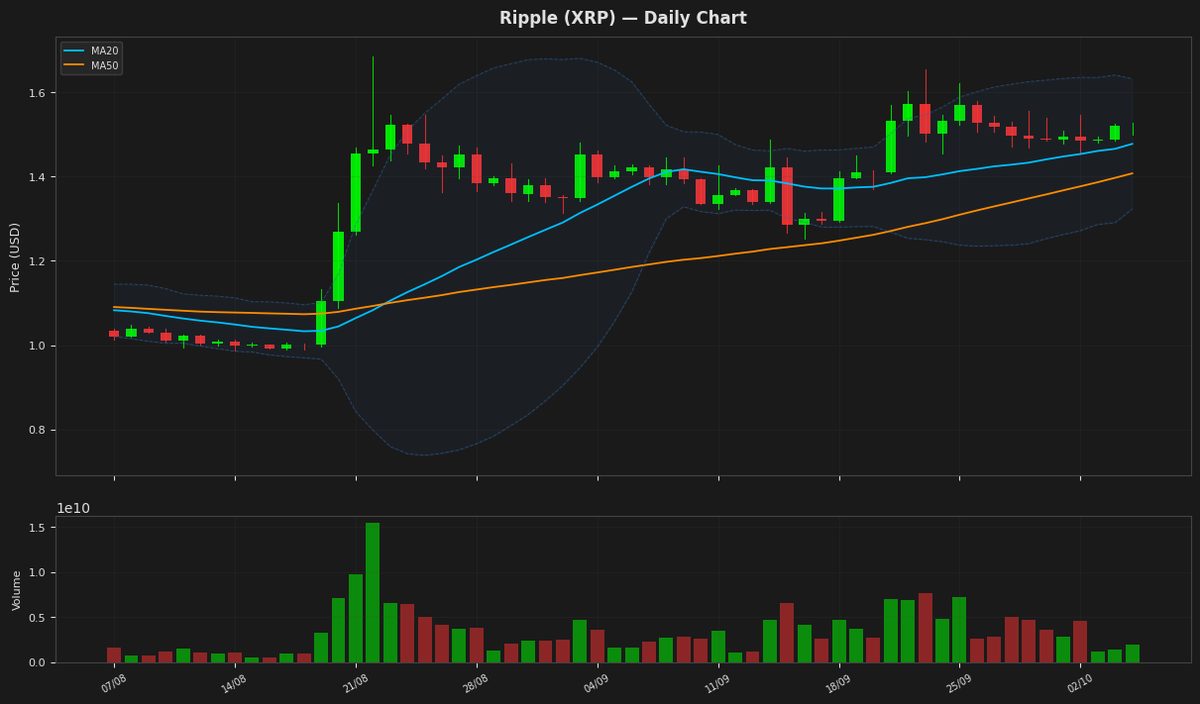
Ripple's price is currently trading at $1.520600, above both its MA20 and MA50, indicating a bullish trend. The RSI is near the neutral zone, suggesting a lack of strong momentum. The Bollinger Bands indicate that the price is still within a relatively wide trading range, with the upper band at $1.631694 and lower band at $1.322909. The MACD is slightly below its signal line, hinting at a potential slowdown in the upward momentum.
Solana (SOL) — +0.17%
$121.7300 52W: $60.4147 — $127.9663
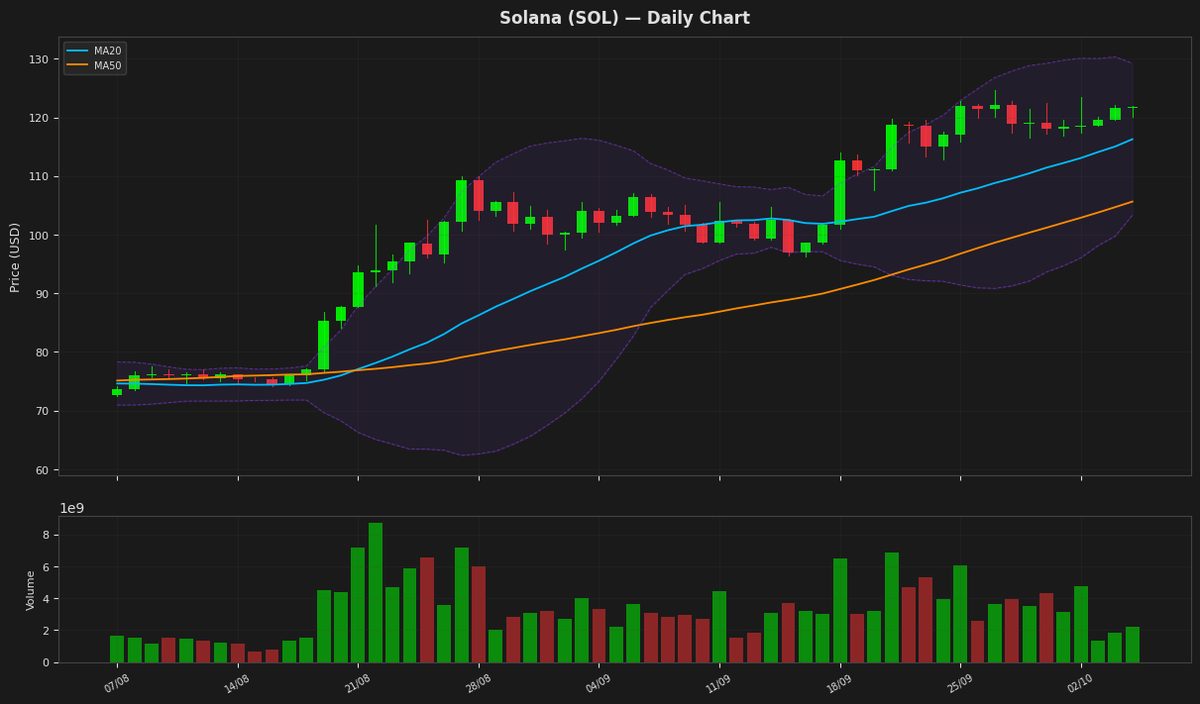
Solana is currently trading at 121.73, maintaining a bullish trend as the price remains above both the 20-day and 50-day moving averages. The RSI of 57.35 indicates neutral to positive momentum, while the price is positioned within the Bollinger Bands with a ceiling at 129.22. Despite the overall strength, the MACD is slightly below the signal line, suggesting a minor deceleration in upward momentum as the asset approaches its 52-week high.
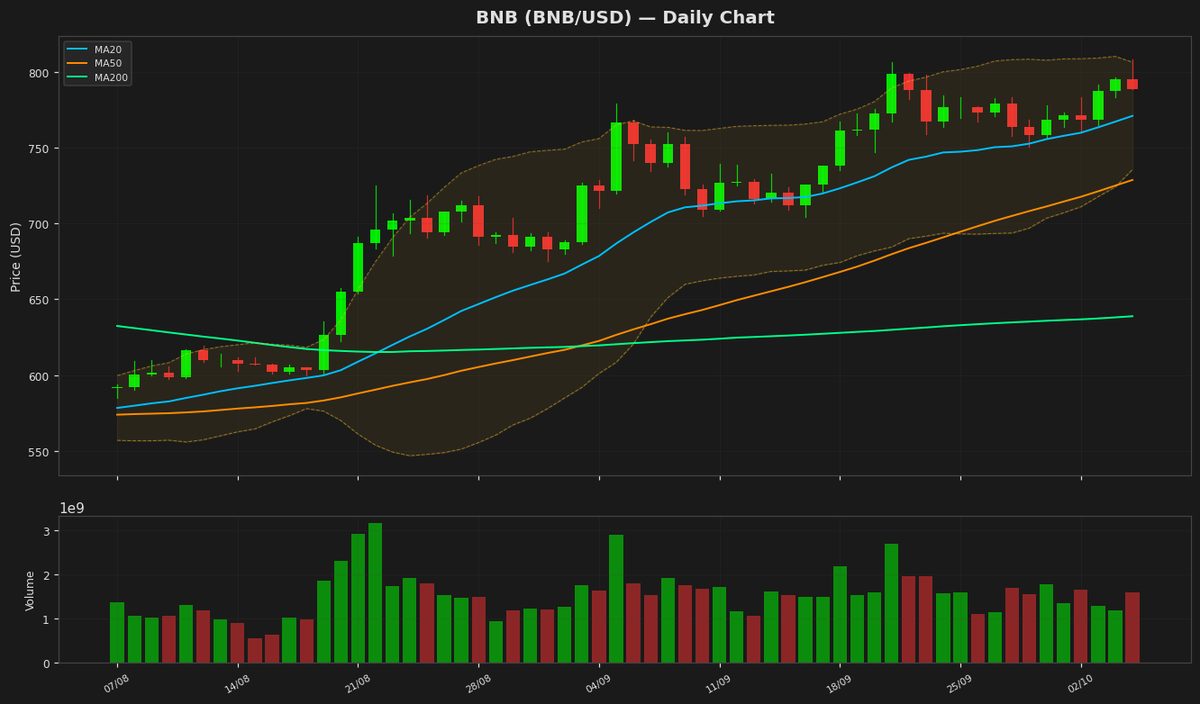
BNB (BNB) — -0.50%
$791.2600 52W: $538.5992 — $907.3658
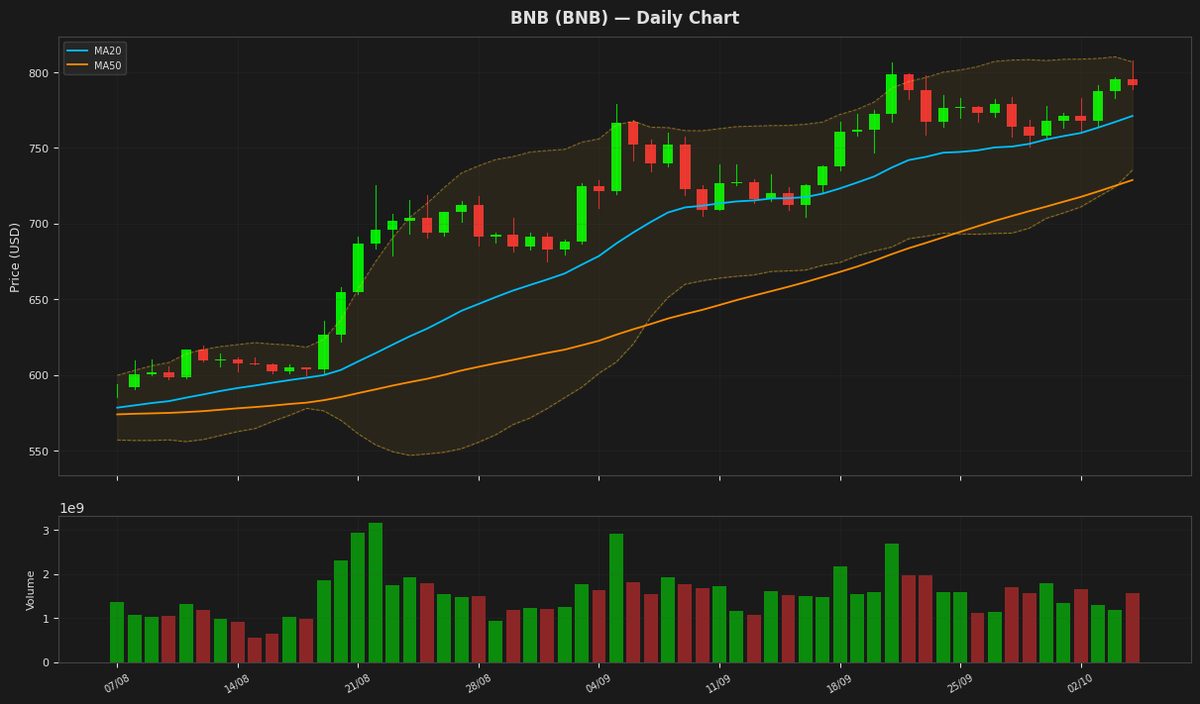
BNB is currently trading at $791.26, with its price hovering near the upper Bollinger Band at $806.78, indicating potential resistance. The RSI is at 46.78, suggesting a neutral stance, while the MACD is below its signal line, indicating a potential bearish crossover. The Average True Range is 19.23, indicating moderate volatility.
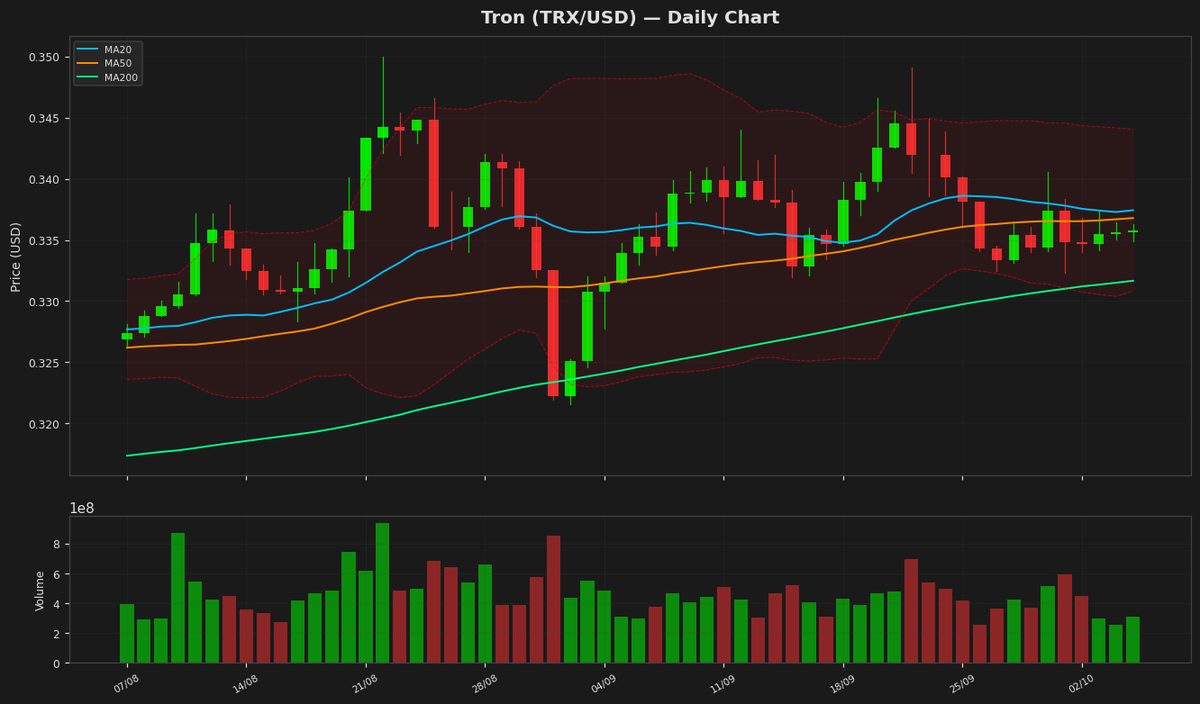
Tron (TRX) — +0.00%
$0.335642 52W: $0.268138 — $0.376332
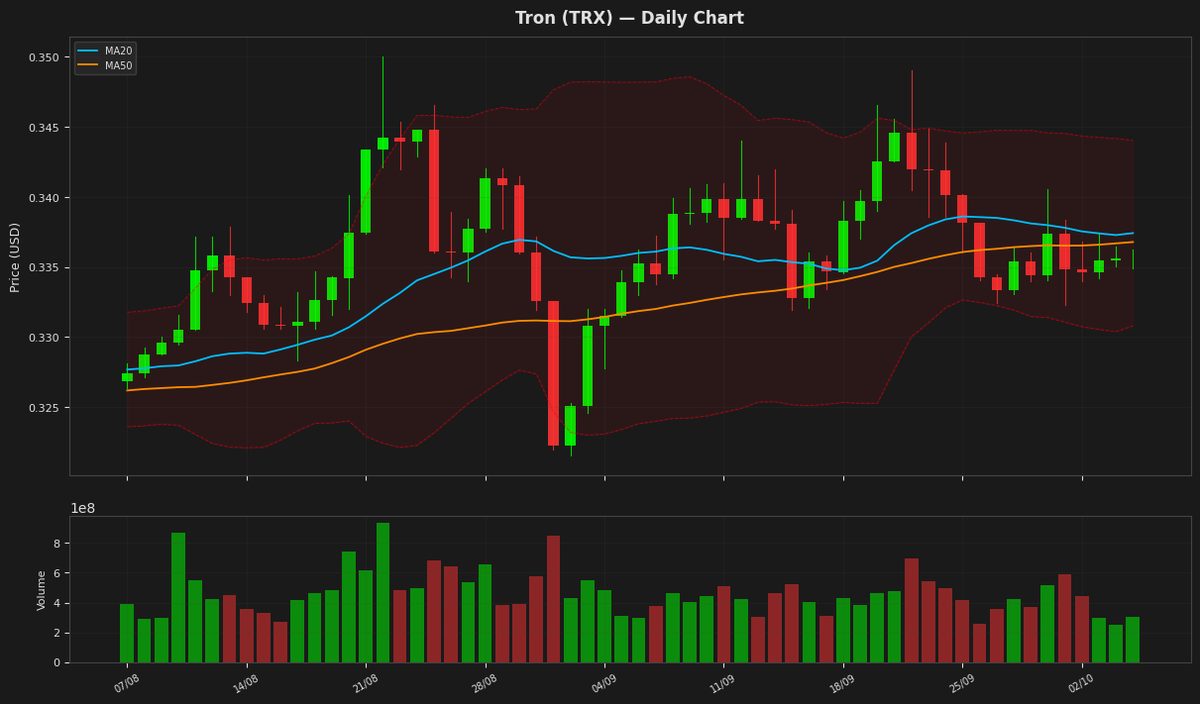
Tron's price is currently at $0.335642, showing a neutral daily change. The RSI value of 28.703908 indicates that TRX is approaching oversold territory, while the MACD is negative and below its signal line, suggesting a bearish trend. The price is near the lower Bollinger Band at $0.330806, indicating potential support.
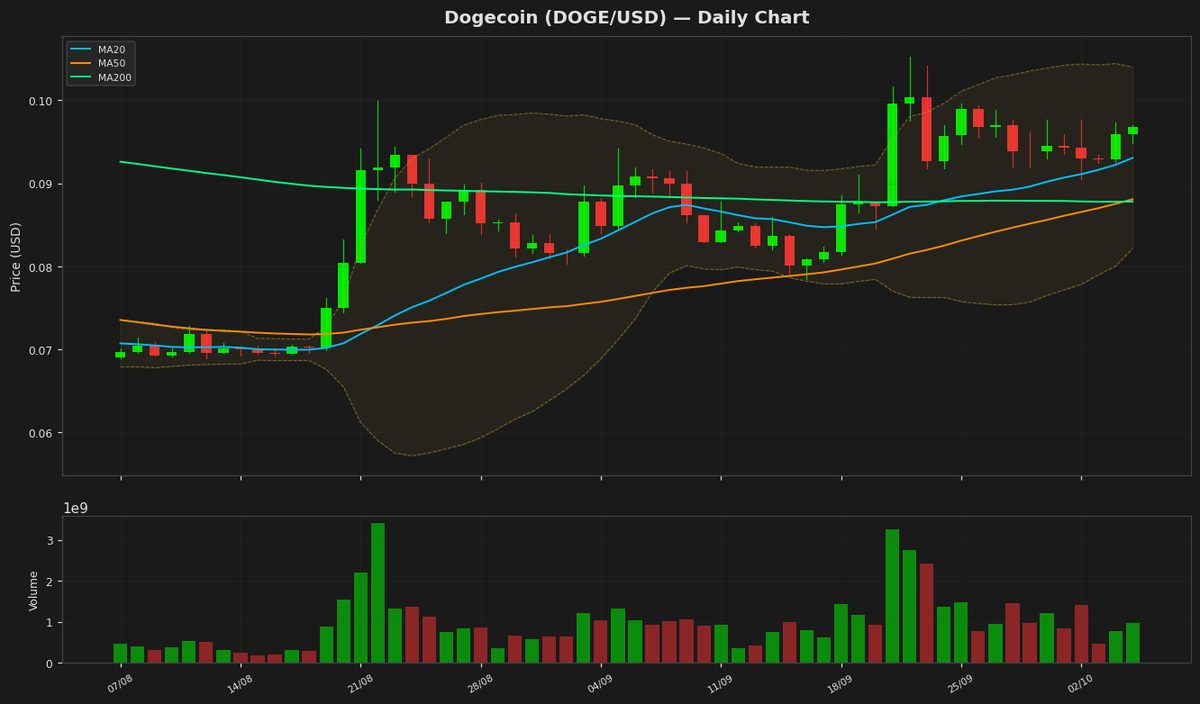
Dogecoin (DOGE) — +0.46%
$0.096320 52W: $0.067973 — $0.127272
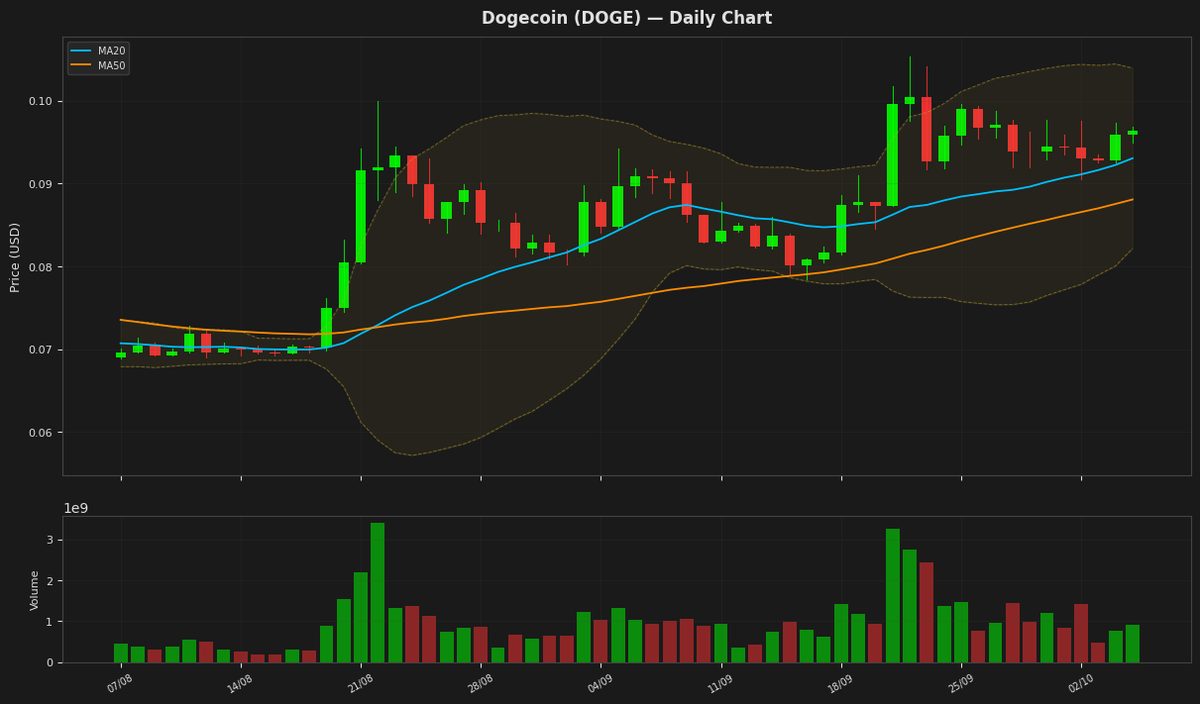
Dogecoin's price is currently trading above its MA20 and MA50, indicating a bullish trend. The RSI is nearing the oversold region but still has room to fall, suggesting potential for further decline. The Bollinger Bands indicate that the price is still within a relatively wide trading range, and the MACD is below its signal line, hinting at a potential slowdown in the upward momentum. The ATR suggests moderate volatility.
Disclaimer
The content on MarketsFN.com is provided for educational and informational purposes only. It does not constitute financial advice or investment recommendations. All investments involve risk. Past performance does not guarantee future results.