Crypto Market Slumps: Dogecoin, Tron, and Solana Lead Today's Losses
QuoteReporter
•5 min read
Crypto Market Slumps: Dogecoin, Tron, and Solana Lead Today's Losses
Crypto Market Report | August 31, 2026
📊 Crypto Market Overview
The cryptocurrency market is currently exhibiting a mixed sentiment, with some assets experiencing gains while others decline. Bitcoin, the largest cryptocurrency by market capitalization, is trading at $78,081.9531, representing a modest increase of 0.32% over the past 24 hours. The Relative Strength Index (RSI) for Bitcoin stands at 81.9, indicating that it is in overbought territory. The MACD is at 4009.2985, further suggesting a strong upward momentum.
Other major cryptocurrencies are displaying varied performance. Ethereum is down 0.27% to $2,436.0000, with an RSI of 78.4 and a MACD of 159.9115, indicating a similarly overbought condition. In contrast, Ripple, Solana, BNB, and Tron are all experiencing declines, ranging from -0.81% to -1.46%. Dogecoin is the worst performer among the listed assets, with a drop of -3.16% to $0.0825.
The macro context is influenced by various factors, including the U.S. jobs report and Russia's digital ruble rollout. The probability of a September Fed rate hike stands at 58%, which is significantly lower than the previously expected 90%. Geopolitical tensions, such as the U.S. hitting Iran, have also impacted the market, sending oil higher and stocks lower. However, Bitcoin has remained relatively stable.
Notable technical signals include the high RSI values for Bitcoin, Ethereum, and Solana, indicating overbought conditions. The MACD values for these assets also suggest strong momentum. Meanwhile, Cronos has halted its network following a $75 million lending exploit on the Tectonic lending app, highlighting the ongoing security risks in the cryptocurrency space. Overall, the market is characterized by a mix of strong momentum and potential risks, with various assets responding to different factors.
Other major cryptocurrencies are displaying varied performance. Ethereum is down 0.27% to $2,436.0000, with an RSI of 78.4 and a MACD of 159.9115, indicating a similarly overbought condition. In contrast, Ripple, Solana, BNB, and Tron are all experiencing declines, ranging from -0.81% to -1.46%. Dogecoin is the worst performer among the listed assets, with a drop of -3.16% to $0.0825.
The macro context is influenced by various factors, including the U.S. jobs report and Russia's digital ruble rollout. The probability of a September Fed rate hike stands at 58%, which is significantly lower than the previously expected 90%. Geopolitical tensions, such as the U.S. hitting Iran, have also impacted the market, sending oil higher and stocks lower. However, Bitcoin has remained relatively stable.
Notable technical signals include the high RSI values for Bitcoin, Ethereum, and Solana, indicating overbought conditions. The MACD values for these assets also suggest strong momentum. Meanwhile, Cronos has halted its network following a $75 million lending exploit on the Tectonic lending app, highlighting the ongoing security risks in the cryptocurrency space. Overall, the market is characterized by a mix of strong momentum and potential risks, with various assets responding to different factors.
📰 Crypto News
- Here’s what happened in crypto today
- Cronos halts network after Tectonic exploit involving estimated $75M
- Bitcoin’s new quantum defenses, 18.9M SOL cancelled: Hodler’s Digest
- U.S. jobs report, Russia’s digital ruble rollout: Crypto Week Ahead
- Live updates: Bitcoin holds $78,000 as yen breaks 160 and rate-hike bets lift the dollar
- Luke Dashjr exits mining pool Ocean after split over Bitcoin mining’s future
- September Fed rate hike fears look overblown as the probability stands at just 58%, not 90%
- Zcash private transactions could go from three-second waits to under 200 milliseconds
- Cronos halts blockchain after $75 million lending exploit hits lending app Tectonic
- Bitcoin barely blinks as U.S. hits Iran, sending oil higher and stocks lower
- Ex-White House Teleprompter Operator Fined for Prediction Market Insider Trading
- Polygon Quietly Patched Security Flaws in Two Hard Forks Before Disclosing Them
- Bitcoin ETFs Snap Nine-Day Inflow Streak as Ethereum Funds Extend Their Run
🔍 Technical Analysis
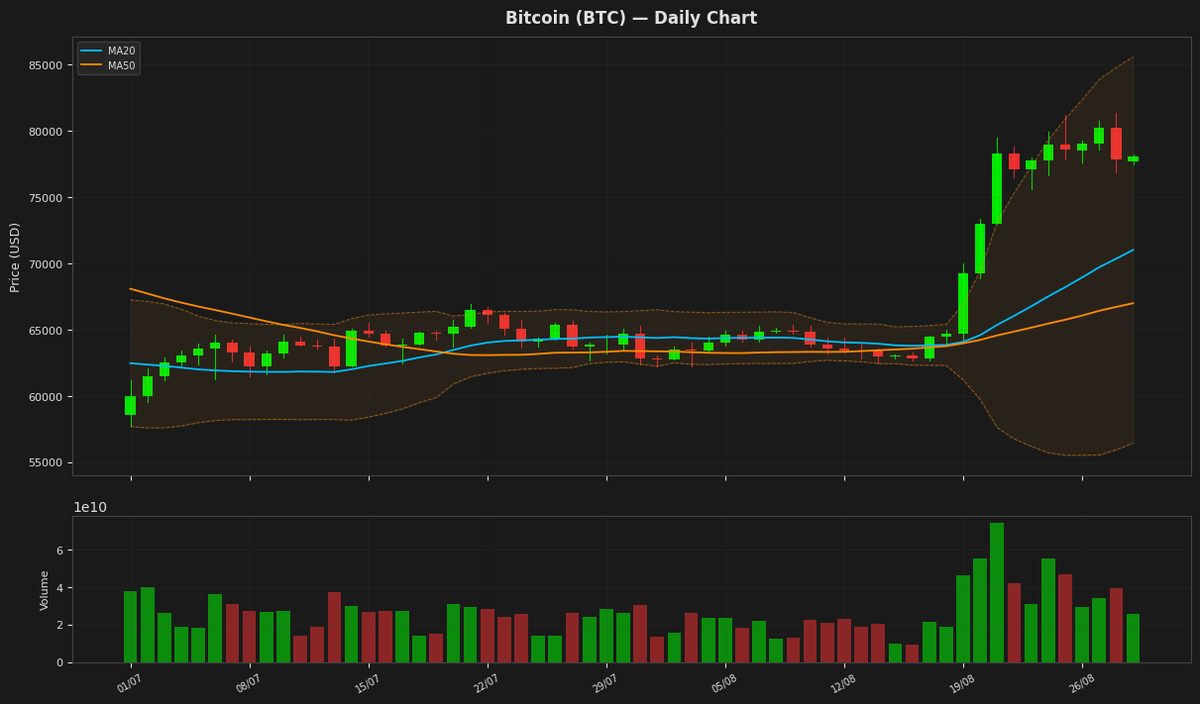
Bitcoin (BTC) — +0.32%
$78,081.95 52W: $57,747.77 — $97,860.60
Bitcoin's price is currently at $78,081.953125, showing a slight increase of 0.32% for the day, and is positioned above both its MA20 and MA50, indicating an overall uptrend. The RSI(14) reading of 81.866615 suggests that Bitcoin is in overbought territory, potentially indicating a risk of a pullback. The MACD is above its signal line, reinforcing the bullish sentiment. The price is also nearing the upper Bollinger Band at $85,601.217658.
Ethereum (ETH) — -0.27%
$2,436.00 52W: $1,506.51 — $3,397.90
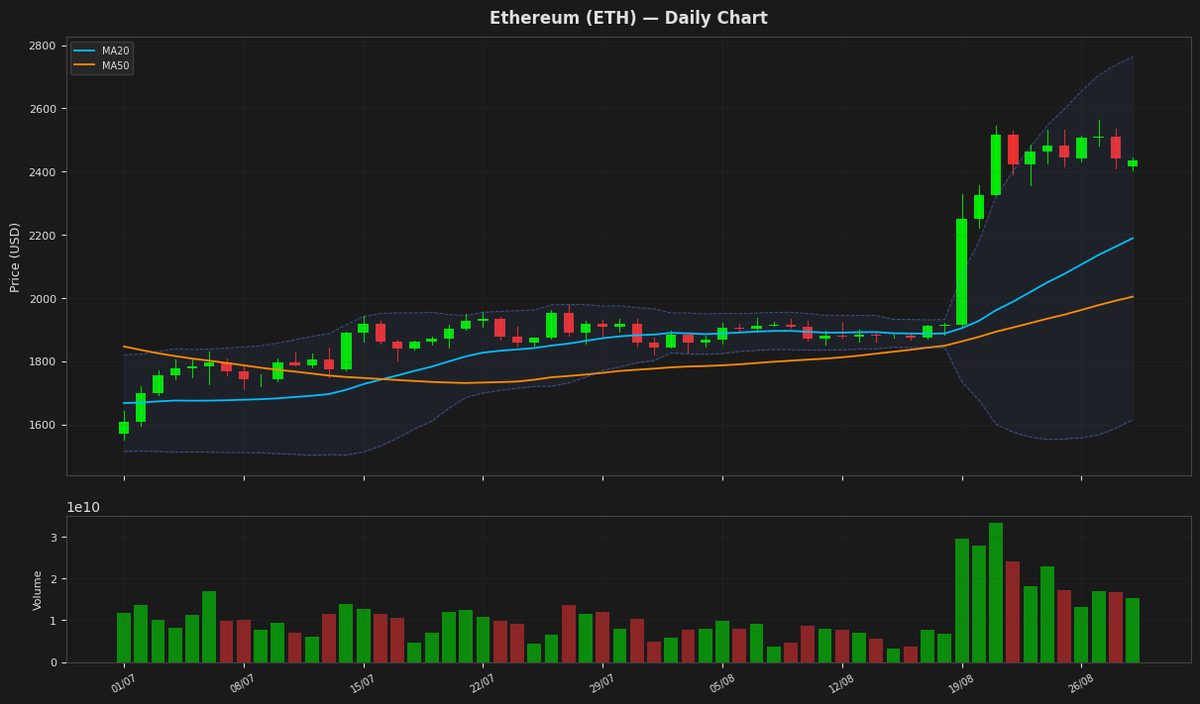
Ethereum's price is currently at $2,436, showing a minor decline, and is positioned near the upper end of its recent trading range, with the RSI indicating overbought conditions at 78.40. The MACD is above its signal line, suggesting a continued bullish trend, although the high RSI value may signal a potential reversal. The price is below the upper Bollinger Band at $2,763, indicating some room for further upside before reaching the upper limit of its recent volatility.
Ripple (XRP) — -1.08%
$1.3683 52W: $0.988422 — $2.4103
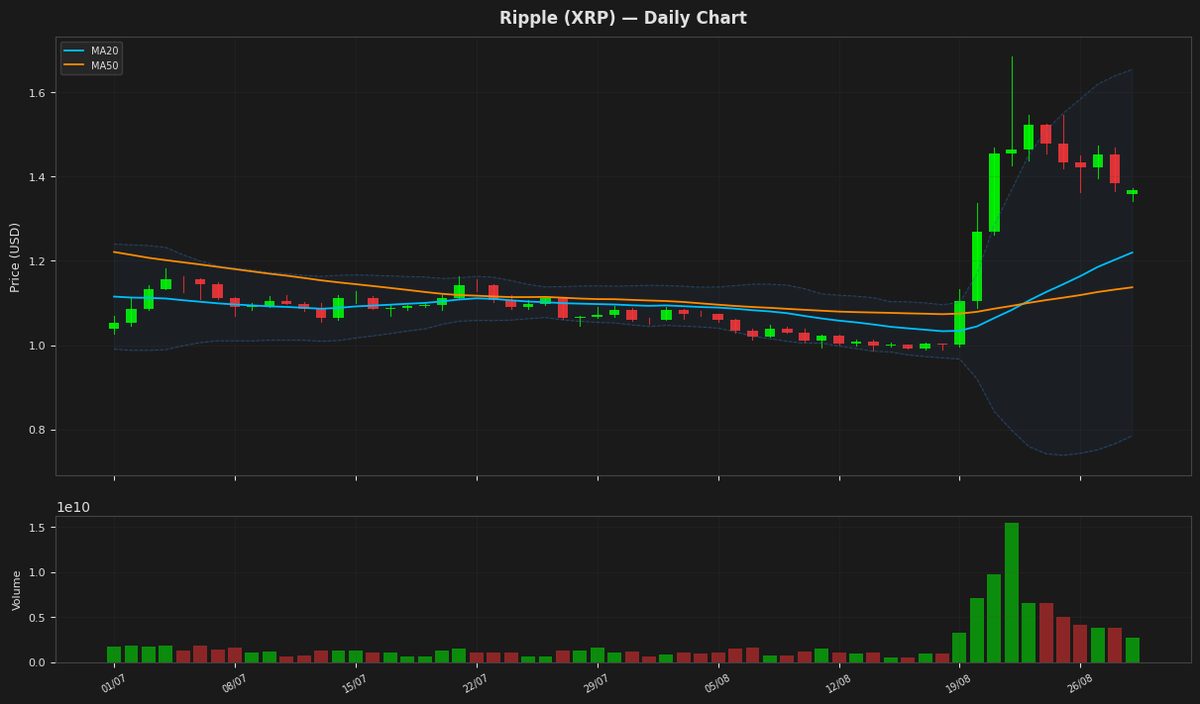
Ripple's price is currently at $1.368300, showing a slight decline of 1.08% in a day, and is positioned above both its MA20 and MA50, indicating an overall uptrend. The RSI is at 74.225237, suggesting that the asset is nearing overbought territory. The Bollinger Bands indicate a potential resistance level around the upper band at $1.653918. The MACD is above its signal line, reinforcing the bullish sentiment.
Solana (SOL) — -1.35%
$102.7200 52W: $60.4147 — $148.2160
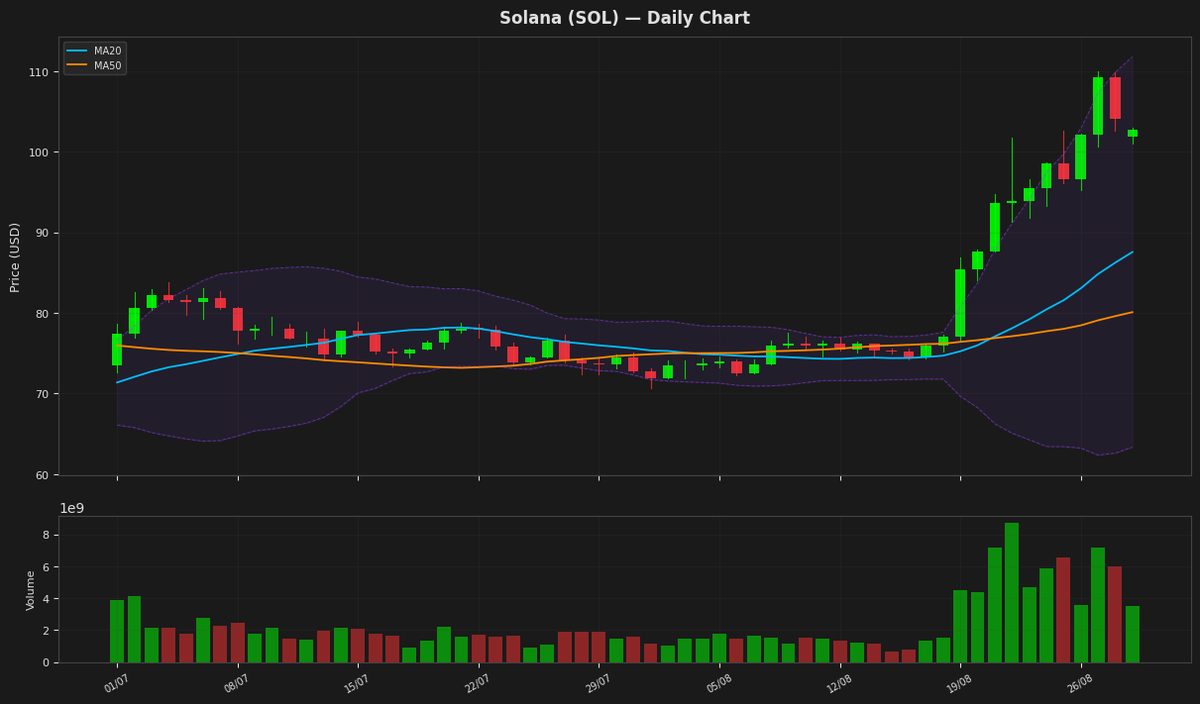
Solana's price is currently at $102.72, showing a slight decline of 1.35% and is nearing the upper Bollinger Band at $111.80, indicating potential overbought conditions as also reflected by the RSI(14) value of 79.96. The MACD is above its signal line, suggesting a bullish trend. The ATR(14) indicates moderate volatility.
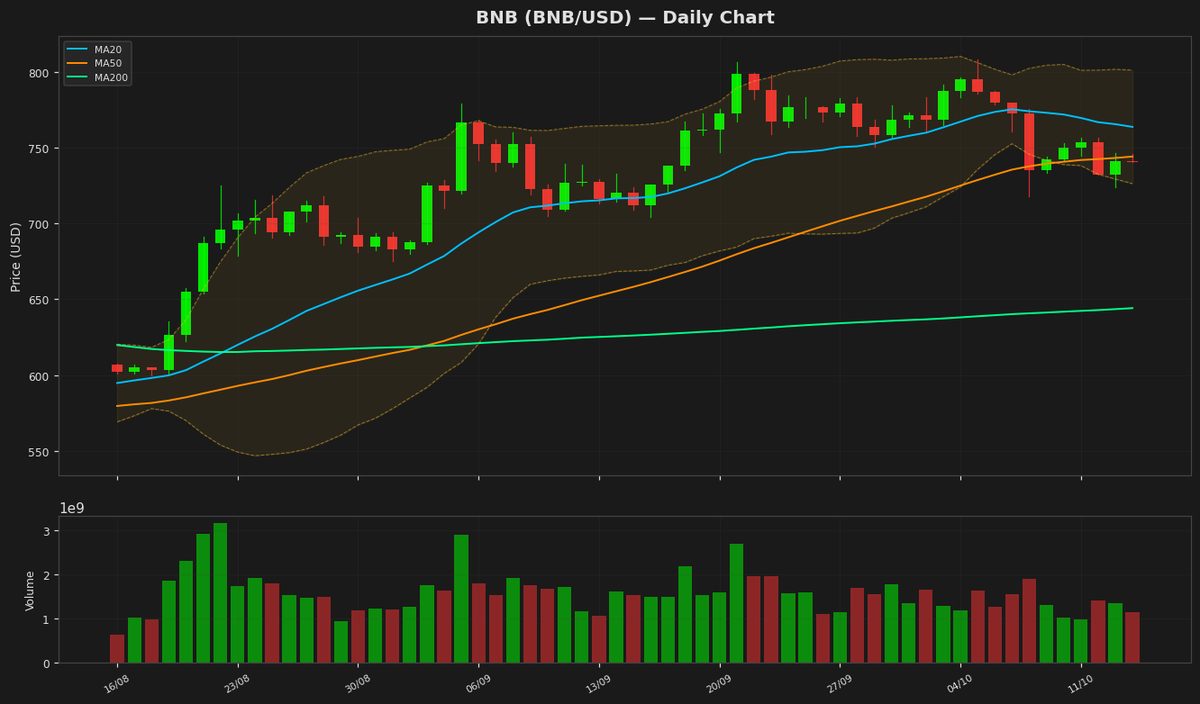
BNB (BNB) — -0.81%
$685.5300 52W: $538.5992 — $954.8583
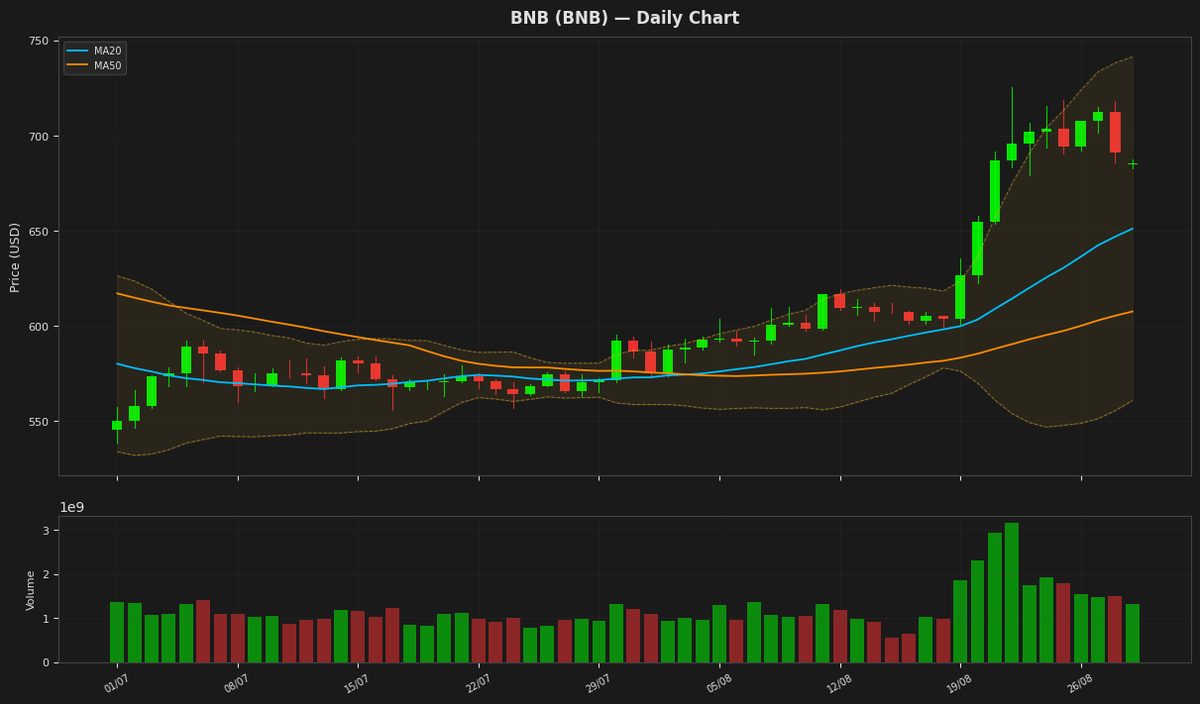
BNB is currently trading at $685.53, with its price above both the MA20 at $651.05 and MA50 at $607.56, indicating an overall uptrend. The RSI is at 73.99, nearing overbought territory, while the MACD is above its signal line, suggesting a continued bullish momentum. The price is also within the upper and lower Bollinger Bands, with the upper band at $741.35 and lower band at $560.76.
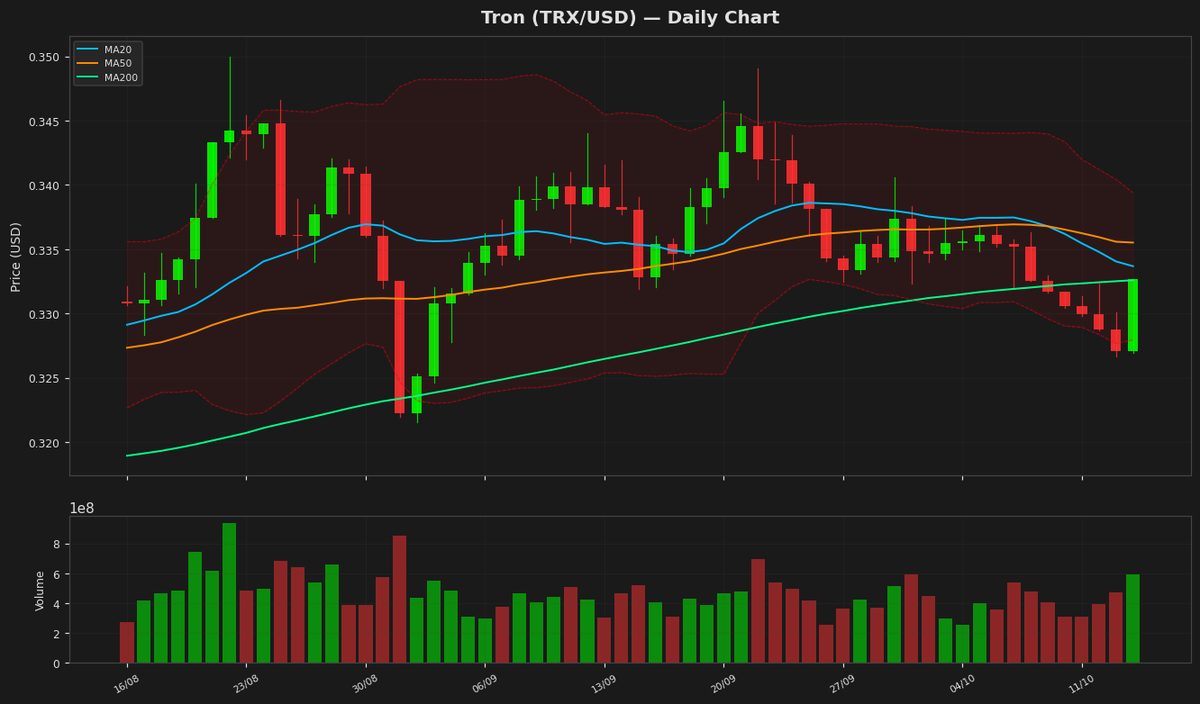
Tron (TRX) — -1.46%
$0.336380 52W: $0.268138 — $0.376332
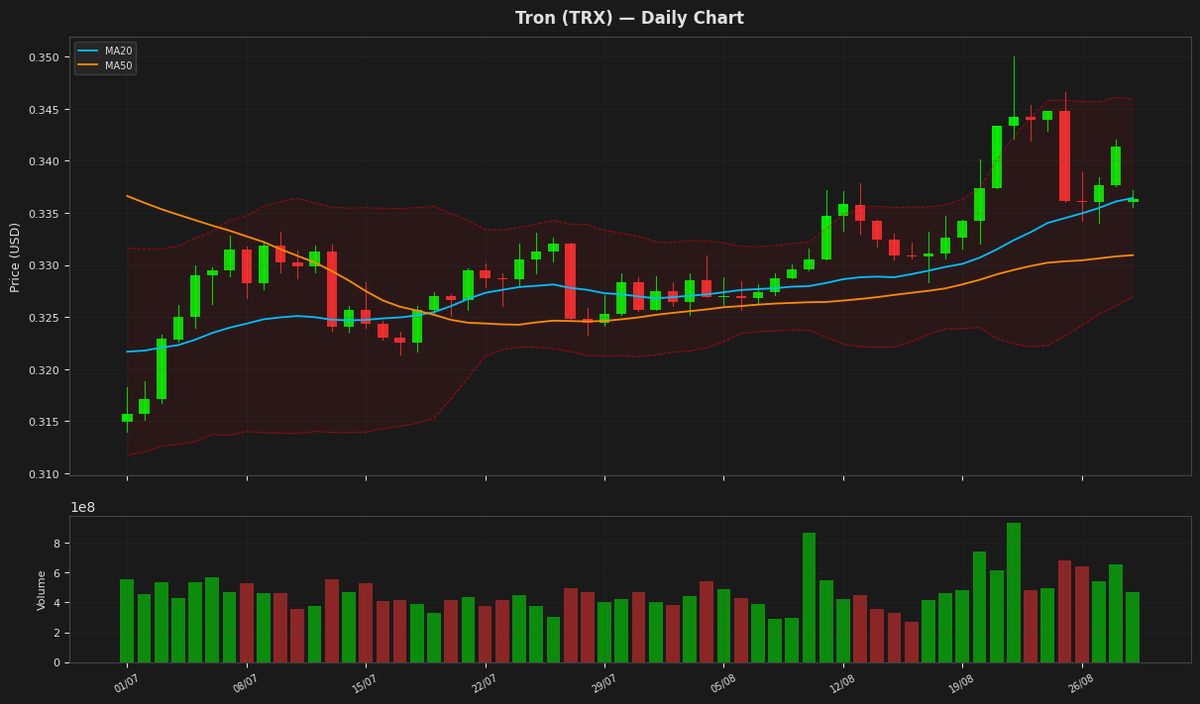
Tron's price is currently at $0.336380, showing a minor decline of 1.46% and hovering around its 20-day moving average of 0.336443, indicating a lack of clear direction. The Relative Strength Index at 58.12 suggests the asset is nearing overbought territory but hasn't reached it yet. The MACD line is below its signal line, indicating a potential bearish signal.
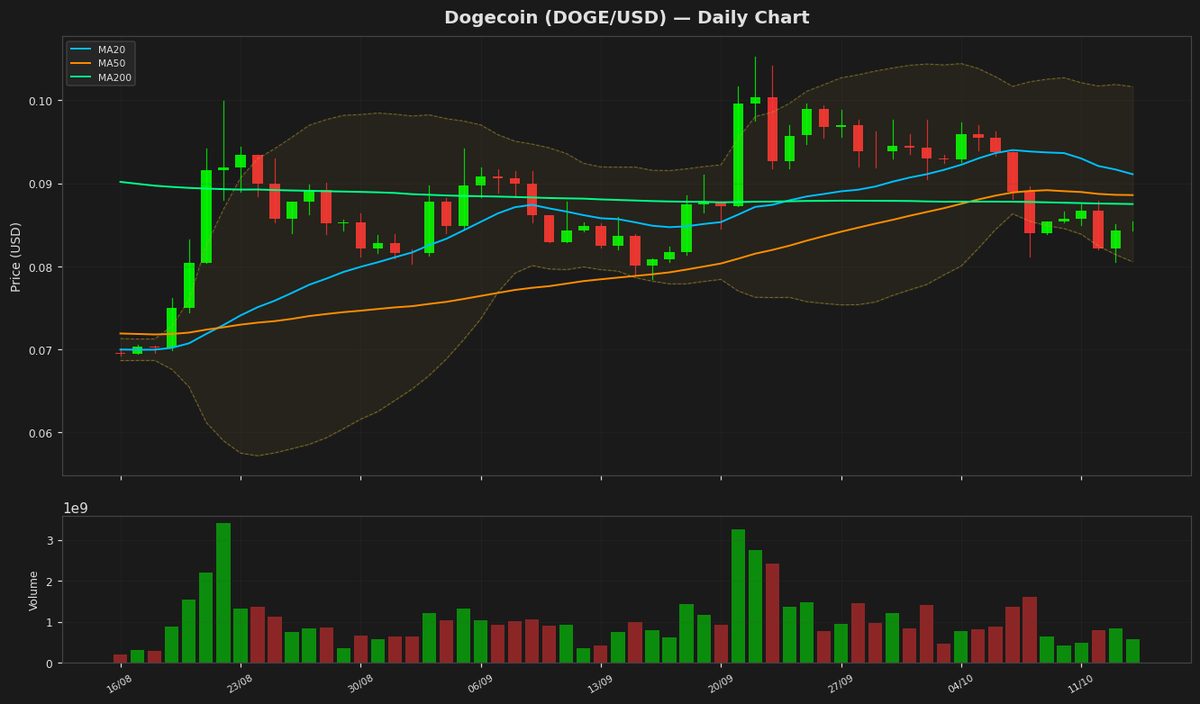
Dogecoin (DOGE) — -3.16%
$0.082530 52W: $0.067973 — $0.156091
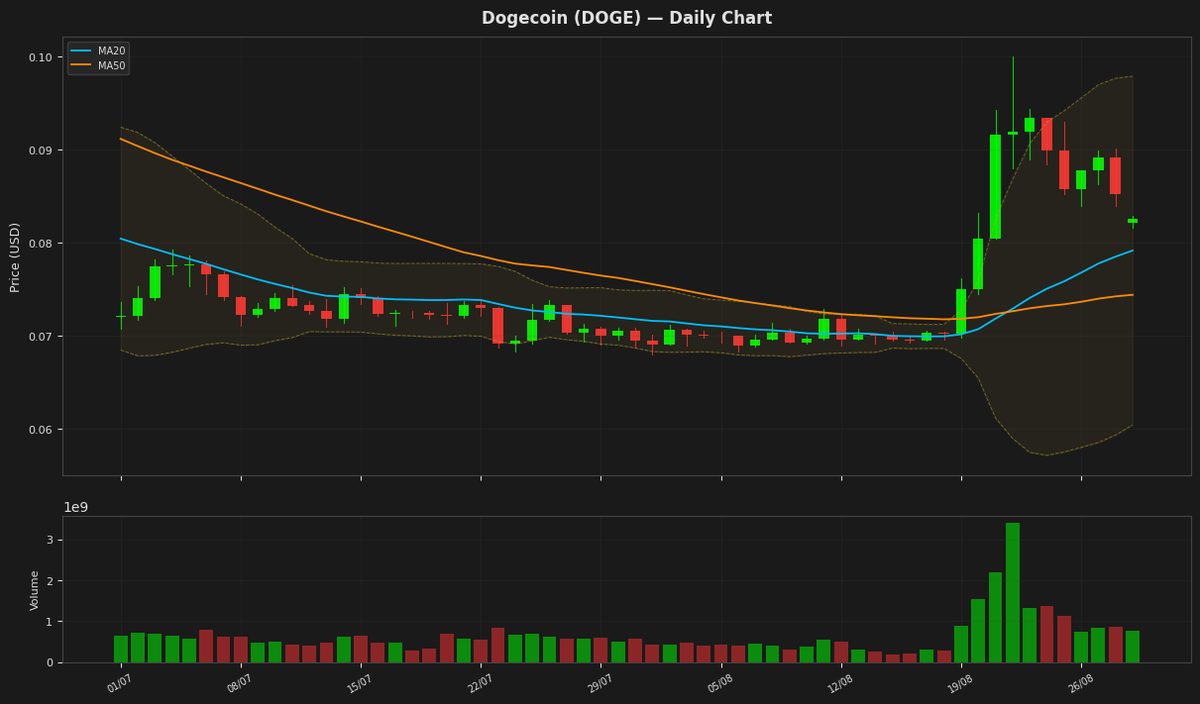
Dogecoin's price is currently at $0.082530, showing a slight decline of 3.16% for the day, yet it remains above both its 20-day and 50-day moving averages, indicating an overall uptrend. The Relative Strength Index (RSI) at 65.44649 suggests the cryptocurrency is nearing overbought territory. The MACD is above its signal line, indicating a bullish signal. The price is also within the upper and lower Bollinger Bands, with the upper band at $0.097902 and lower band at $0.060443.
Disclaimer
The content on MarketsFN.com is provided for educational and informational purposes only. It does not constitute financial advice or investment recommendations. All investments involve risk. Past performance does not guarantee future results.