Crypto Market Slumps: Dogecoin, Ethereum, and Ripple Lead Losses Today
QuoteReporter
•5 min read
Crypto Market Slumps: Dogecoin, Ethereum, and Ripple Lead Losses Today
Crypto Market Report | October 07, 2026
📊 Crypto Market Overview
The cryptocurrency market is currently experiencing a downturn, with major assets such as Bitcoin, Ethereum, and Dogecoin witnessing declines of over 1%, 3%, and 3% respectively. Bitcoin's price has dropped to $83,981, accompanied by a Relative Strength Index (RSI) of 47.5, indicating a neutral stance, while its MACD stands at 1745.4594. Ethereum's RSI has dipped to 36.9, suggesting it is approaching oversold territory, with a MACD of 49.7377.
Among other key movers, Solana and Ripple have also seen declines, with Solana's RSI at 58.9 and Ripple's at 43.1. BNB has been relatively more stable, with a decline of less than 1% and an RSI of 53.9. Tron, on the other hand, has an RSI of 29.9, indicating it is in oversold territory.
The macroeconomic context is seeing some significant developments, with Russia clearing its first crypto exchanges and custodians under a new law, potentially paving the way for increased adoption. Conversely, regulatory challenges continue, as evidenced by the DOJ invoking a previous ruling in a case against Roman Storm and Bitcoin.de's trading being halted due to a rejected MiCA application.
Notable technical signals include Ethereum's RSI approaching oversold territory and Tron's RSI indicating it is already oversold. The MACD values for most major cryptocurrencies remain positive, except for Tron, which is slightly negative. The market is also seeing significant moves by the U.S. government, with over $100 million in BTC and BNB being transferred, although a sale has not been confirmed. Overall, the market sentiment remains cautious, with a mix of regulatory developments and technical signals influencing the current landscape.
Among other key movers, Solana and Ripple have also seen declines, with Solana's RSI at 58.9 and Ripple's at 43.1. BNB has been relatively more stable, with a decline of less than 1% and an RSI of 53.9. Tron, on the other hand, has an RSI of 29.9, indicating it is in oversold territory.
The macroeconomic context is seeing some significant developments, with Russia clearing its first crypto exchanges and custodians under a new law, potentially paving the way for increased adoption. Conversely, regulatory challenges continue, as evidenced by the DOJ invoking a previous ruling in a case against Roman Storm and Bitcoin.de's trading being halted due to a rejected MiCA application.
Notable technical signals include Ethereum's RSI approaching oversold territory and Tron's RSI indicating it is already oversold. The MACD values for most major cryptocurrencies remain positive, except for Tron, which is slightly negative. The market is also seeing significant moves by the U.S. government, with over $100 million in BTC and BNB being transferred, although a sale has not been confirmed. Overall, the market sentiment remains cautious, with a mix of regulatory developments and technical signals influencing the current landscape.
📰 Crypto News
- Russia clears first crypto exchanges, custodians under new law
- DOJ invokes Bitcoin Fog ruling in potential blow to Roman Storm acquittal bid
- Here’s what happened in crypto today
- Kalshi’s 15-min gold markets overtake Ether just weeks after launch
- Bitcoin.de trading remains halted as German regulator rejects MiCA application
- Pudgy Penguins-backed Abstract to shut down after ‘tens of millions’ in losses
- Conduit sues Tether over allegedly freezing $2.8M without explanation
- Winklevoss-backed Zcash ETF files with SEC for Nasdaq listing
- Down but not out. Bitcoin's stair-step bullish trajectory is still intact
- U.S. government moves over $100 million in BTC and BNB. A sale hasn't been confirmed
- Pudgy Penguins’ Abstract becomes second Ethereum layer 2 to shut in a week
- Cardano gives token issuers power to freeze, seize and restrict assets
- Bitcoin dips below $84,000 as oil jumps on Iranian tanker attacks
- Google Launches Nano Banana 2.1: Better Than Its Predecessor at Half the Price
- Circle Welcomes DJ Khaled to 'Team USDC' and Crypto Twitter Is Furious
🔍 Technical Analysis
Bitcoin (BTC) — -1.84%
$83,981.16 52W: $57,747.77 — $89,200.78
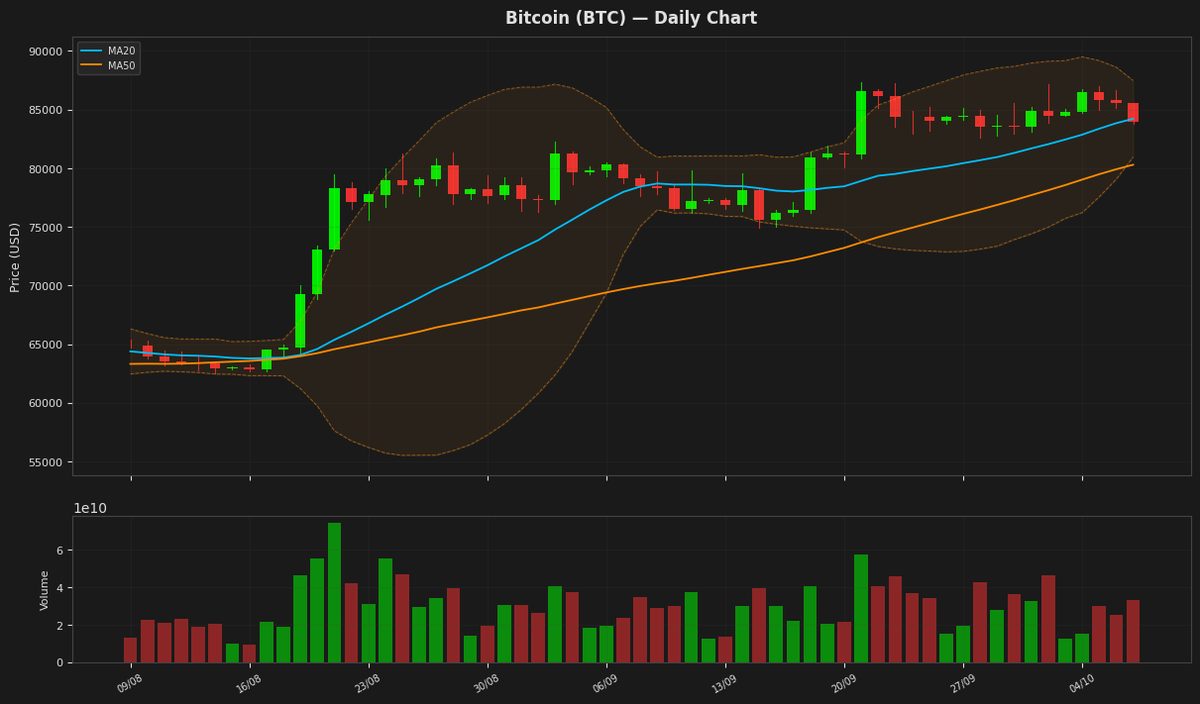
Bitcoin's price is currently at $83,981, showing a slight decline of 1.84% and hovering near the middle of the Bollinger Bands, with the upper band at $87,478 and the lower band at $80,953. The RSI is at 47.50, indicating a neutral stance, while the MACD is below its signal line, suggesting a potential bearish trend. The ATR remains high at $1,848, indicating significant price volatility.
Ethereum (ETH) — -3.09%
$2,614.21 52W: $1,506.51 — $3,008.04
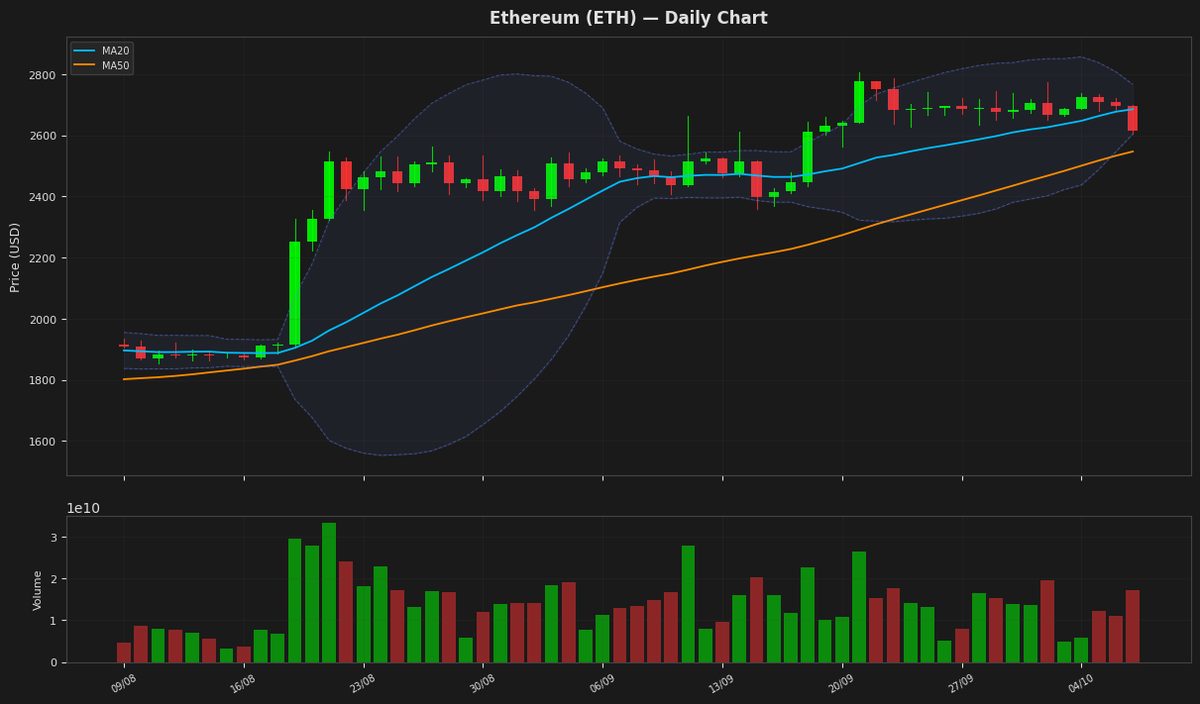
Ethereum's price is currently at $2,614.21, showing a decline of 3.09% for the day, and is positioned near the lower Bollinger Band at $2,604.62, indicating potential support. The RSI is at 36.92, suggesting the asset is approaching oversold territory. The MACD is below its signal line, indicating a bearish trend, and the ATR suggests moderate volatility.
Ripple (XRP) — -2.11%
$1.4657 52W: $0.988422 — $1.9091
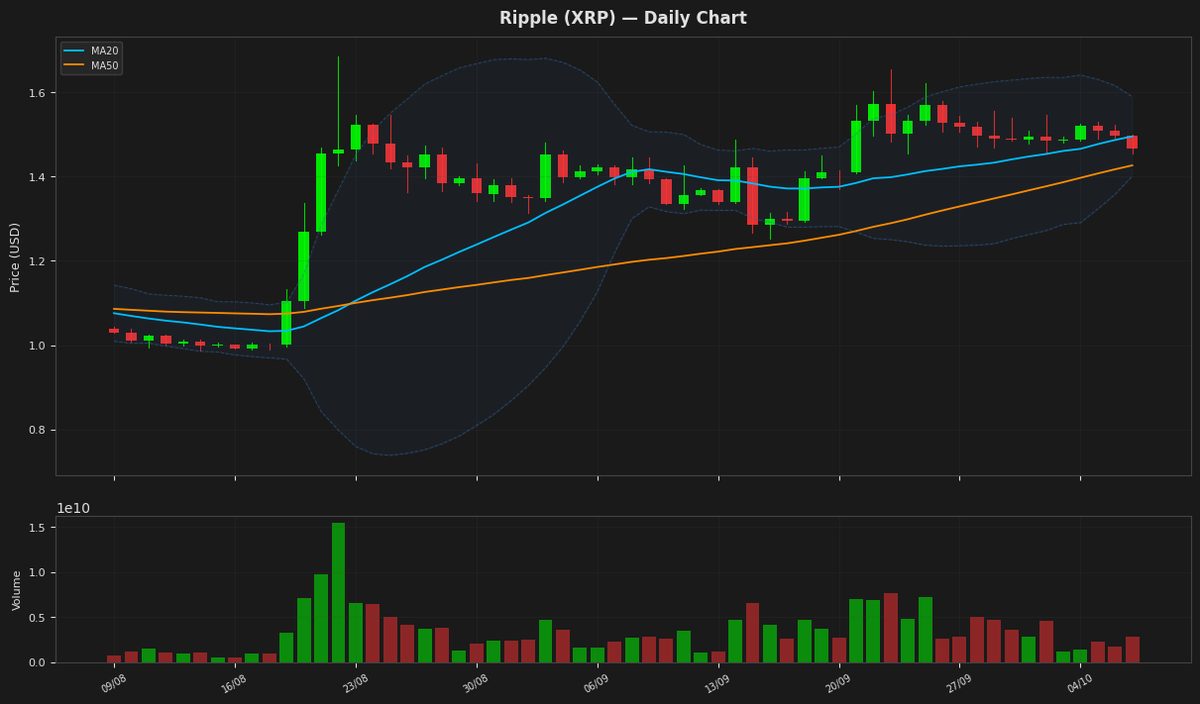
Ripple's price is currently at $1.465700, showing a decline of 2.11% for the day, and is positioned between the 20-day and 50-day moving averages, indicating a lack of clear direction. The Relative Strength Index is at 43.090776, suggesting the asset is nearing oversold territory. The Bollinger Bands indicate support around 1.401091 and resistance at 1.588977. The MACD is below its signal line, indicating a potential bearish trend.
Solana (SOL) — -1.94%
$118.4400 52W: $60.4147 — $125.1867
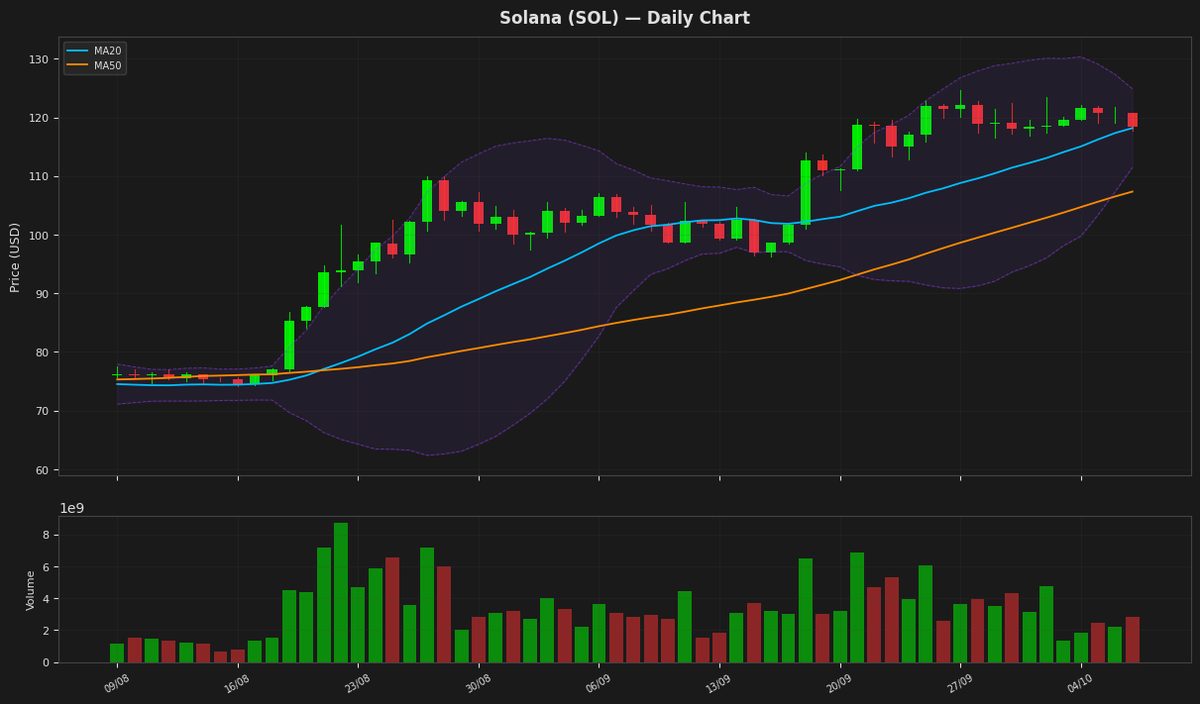
Solana's price is currently at $118.44, showing a minor decline of 1.94% and hovering around its 20-day moving average of $118.18. The Relative Strength Index (RSI) at 58.91 indicates a neutral to slightly bullish sentiment, while the MACD is below its signal line, suggesting a potential slowdown in the upward momentum. The Bollinger Bands indicate that the price is near the upper band at $124.87, suggesting it is relatively high.
BNB (BNB) — -0.57%
$775.1800 52W: $538.5992 — $904.4391
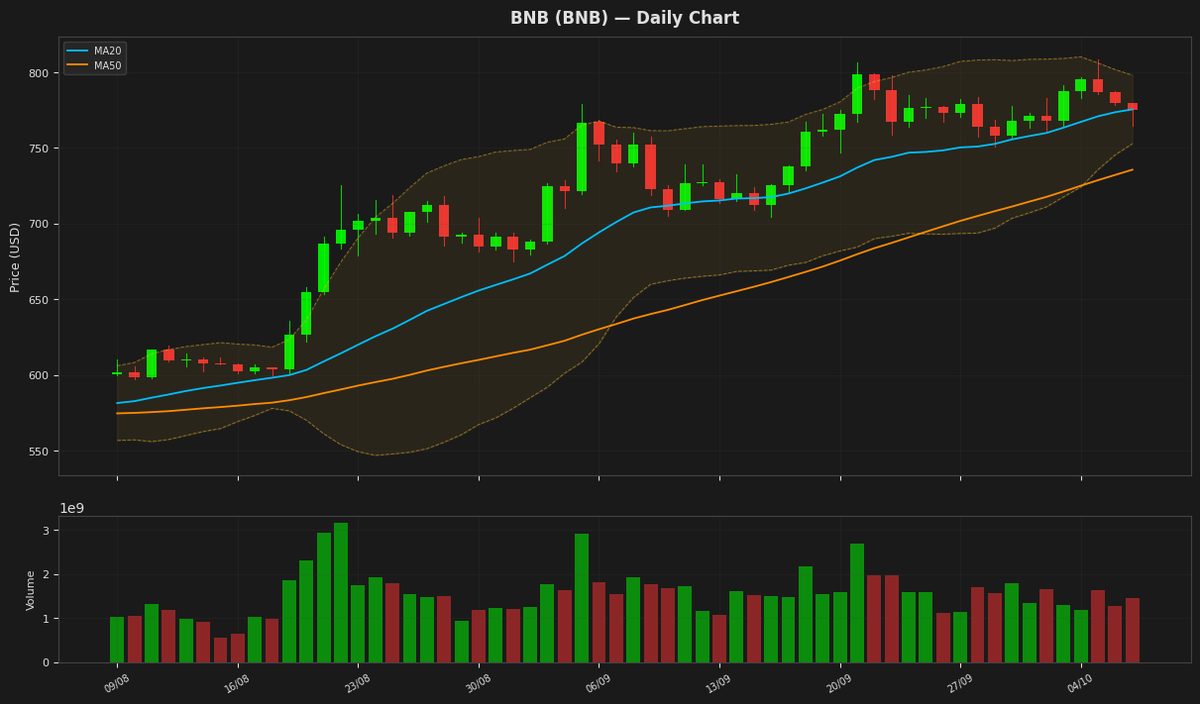
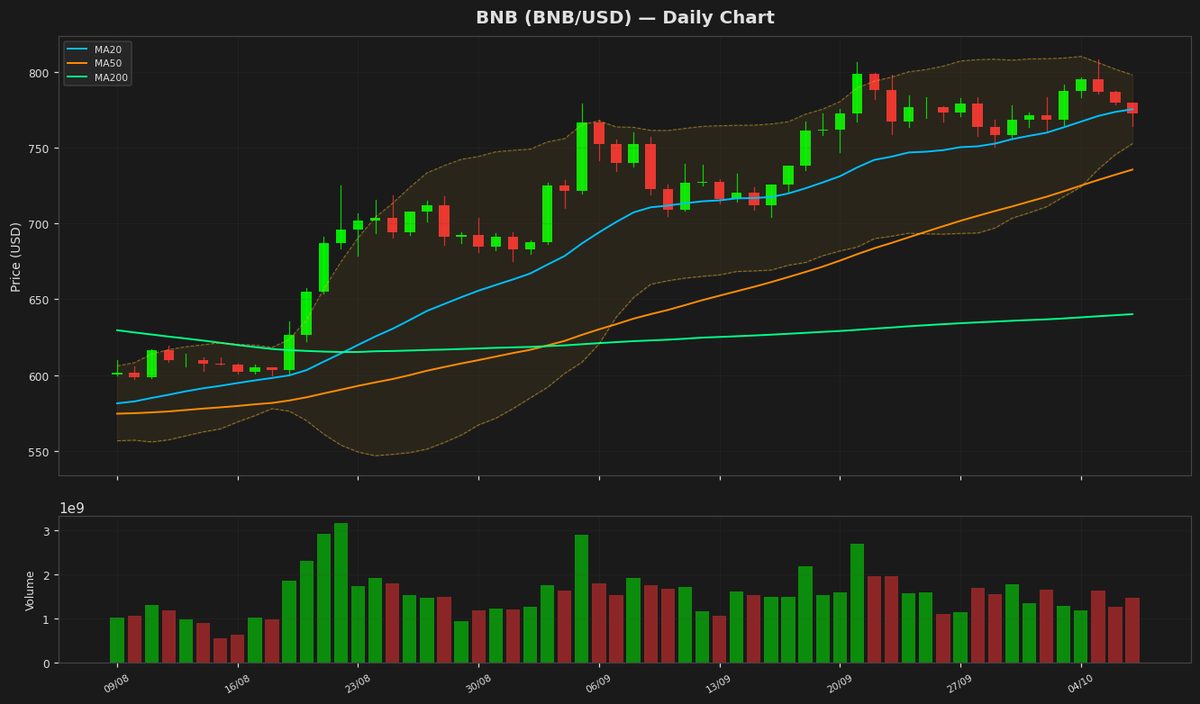
BNB is currently trading at $775.18, near its 20-day moving average of $775.43, indicating a lack of clear direction. The Relative Strength Index (RSI) at 53.85 suggests a neutral market sentiment, while the MACD below its signal line indicates a potential bearish signal. The price is also within the Bollinger Bands, with the upper and lower bands at $798.08 and $752.79 respectively, indicating a stable price movement.
Tron (TRX) — -0.65%
$0.333220 52W: $0.268138 — $0.376332
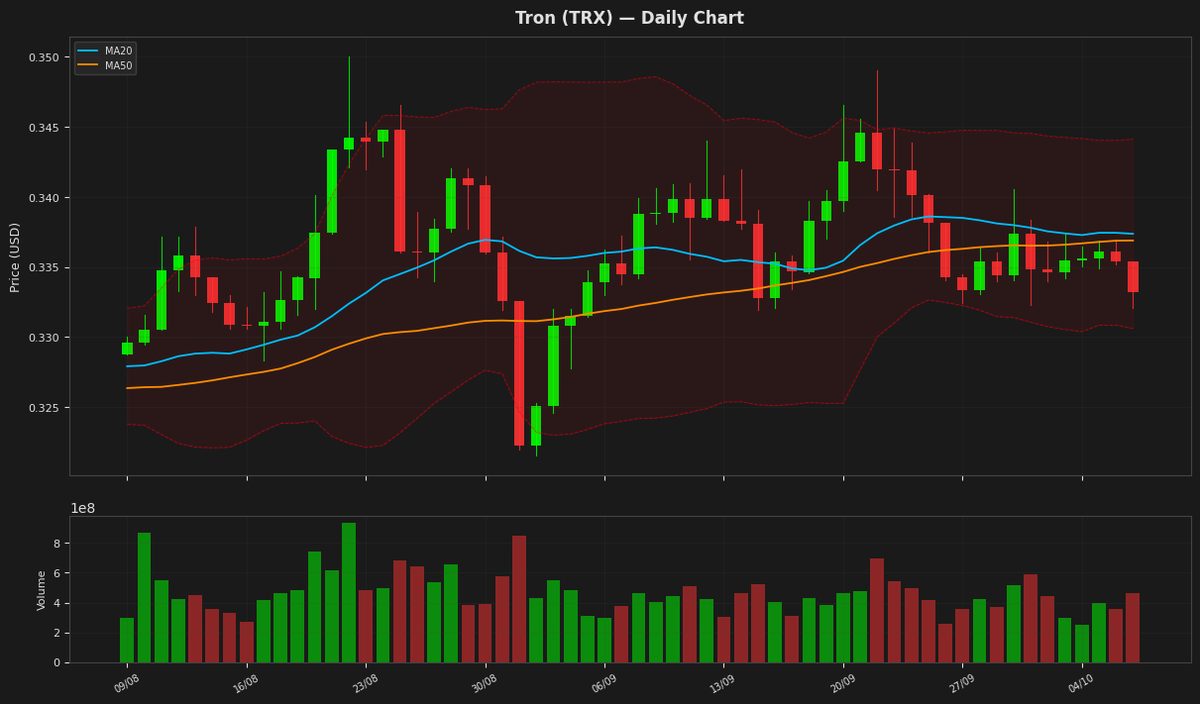
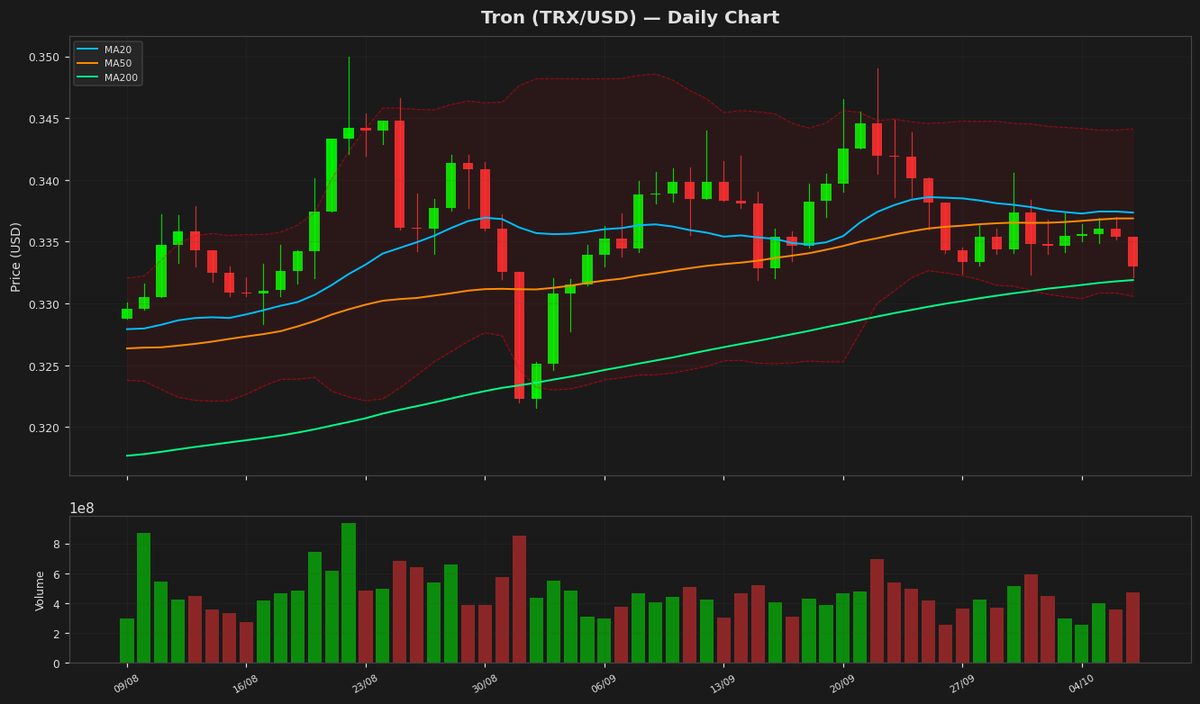
Tron's price is currently at $0.333220, showing a minor decline, and is positioned near the lower band of the Bollinger Bands at $0.33062, indicating potential support. The RSI is at 29.885455, suggesting oversold conditions, which could lead to a potential bounce. The MACD is below the signal line, indicating a bearish trend, but the negative divergence is narrowing, hinting at a possible reversal. The ATR indicates low volatility.
Dogecoin (DOGE) — -3.10%
$0.090840 52W: $0.067973 — $0.124902
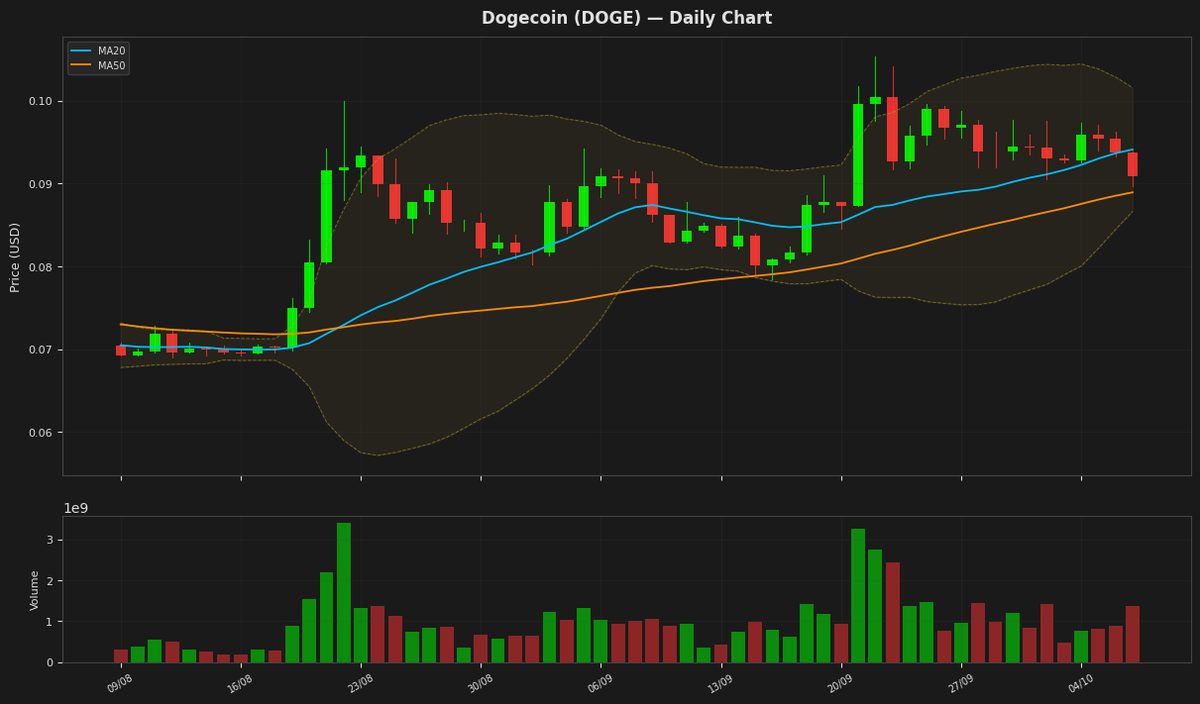
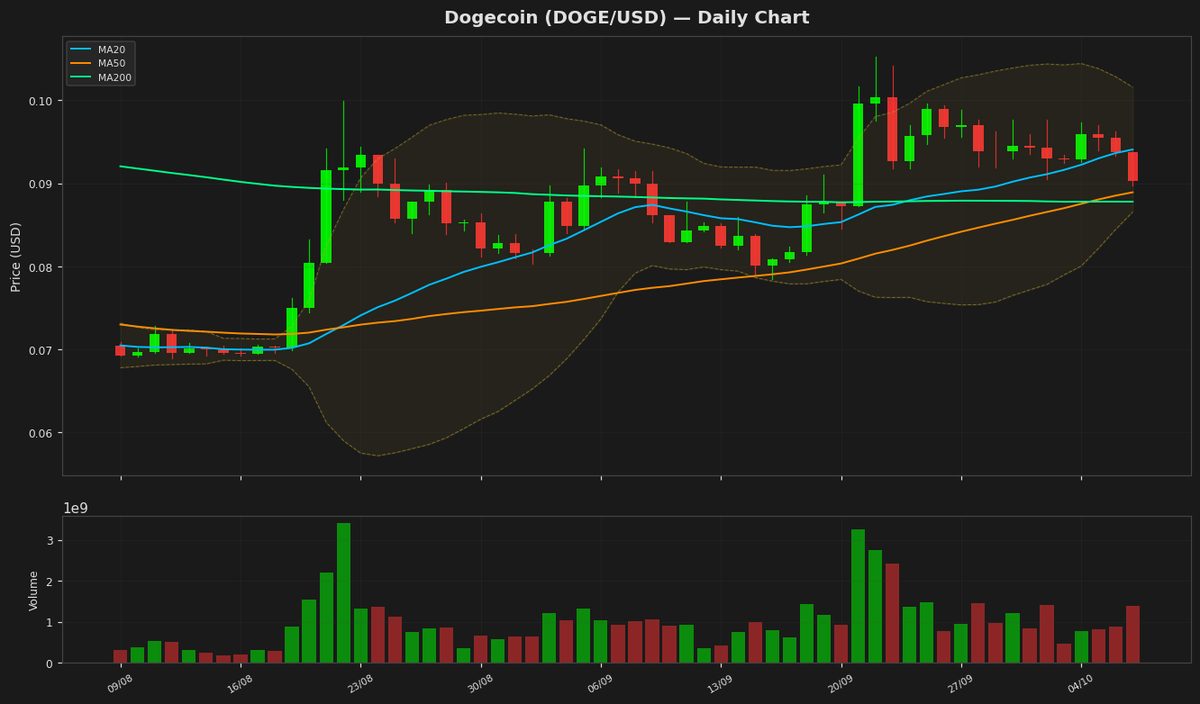
Dogecoin is currently trading at $0.090840, showing a bearish short-term trend as it sits below the MA20 of $0.09409 but remains supported by the MA50 at $0.088921. The RSI of 45.84 indicates neutral momentum, while the MACD is slightly below the signal line, suggesting a minor bearish crossover. Price action remains contained within the Bollinger Bands, with the lower band at $0.086629 serving as immediate support.
Disclaimer
The content on MarketsFN.com is provided for educational and informational purposes only. It does not constitute financial advice or investment recommendations. All investments involve risk. Past performance does not guarantee future results.