Crypto Market Sees Gains: Solana, Dogecoin, and Ethereum Lead the Charge
QuoteReporter
•5 min read
Crypto Market Sees Gains: Solana, Dogecoin, and Ethereum Lead the Charge
Crypto Market Report | August 27, 2026
📊 Crypto Market Overview
The cryptocurrency market is currently exhibiting a positive sentiment, with most major assets trading in the green. Bitcoin is trading at $79,799.7578, having risen by 0.98% today, and is hovering just below the $80,000 mark. Other top cryptocurrencies, including Ethereum, Ripple, Solana, and BNB, are also seeing gains, with Solana leading the way with a 2.20% increase.
From a technical perspective, several major cryptocurrencies are showing signs of being overbought, with Bitcoin's RSI standing at 89.1 and Solana's at 89.9. Ethereum and BNB are also in overbought territory, with RSI values of 85.0 and 86.5, respectively. The MACD indicators for these assets are also positive, suggesting continued upward momentum in the short term.
The macro context remains relevant, with the recent slowdown in Bitcoin ETF inflows to $232M potentially indicating a decrease in investor appetite. Meanwhile, economists at the Dallas Fed have warned that tokenized deposits could raise US credit costs, highlighting the growing intersection between traditional finance and the cryptocurrency market.
Notable developments in the space include the revelation of multiple vulnerabilities in Core Lightning, prompting a security update, and the testing of quantum-resistant Bitcoin transactions on the mainnet by StarkWare. Researchers are also exploring solutions to make Bitcoin more quantum-secure, although these proposals come with potential drawbacks. Overall, the market is continuing to evolve, with ongoing developments in both the technical and macroeconomic landscape. The current market sentiment is positive, but the overbought conditions of several major assets warrant caution.
From a technical perspective, several major cryptocurrencies are showing signs of being overbought, with Bitcoin's RSI standing at 89.1 and Solana's at 89.9. Ethereum and BNB are also in overbought territory, with RSI values of 85.0 and 86.5, respectively. The MACD indicators for these assets are also positive, suggesting continued upward momentum in the short term.
The macro context remains relevant, with the recent slowdown in Bitcoin ETF inflows to $232M potentially indicating a decrease in investor appetite. Meanwhile, economists at the Dallas Fed have warned that tokenized deposits could raise US credit costs, highlighting the growing intersection between traditional finance and the cryptocurrency market.
Notable developments in the space include the revelation of multiple vulnerabilities in Core Lightning, prompting a security update, and the testing of quantum-resistant Bitcoin transactions on the mainnet by StarkWare. Researchers are also exploring solutions to make Bitcoin more quantum-secure, although these proposals come with potential drawbacks. Overall, the market is continuing to evolve, with ongoing developments in both the technical and macroeconomic landscape. The current market sentiment is positive, but the overbought conditions of several major assets warrant caution.
📰 Crypto News
- Core Lightning confirms multiple vulnerabilities, prepares security update
- Bitcoin ETF inflows slow to $232M as BTC holds under $80K
- Here’s what happened in crypto today
- Tokenized deposits could raise US credit costs: Dallas Fed economists
- StarkWare tests quantum-resistant Bitcoin transaction on mainnet
- SHRINCS BIP published: Quantum-secure Bitcoin comes with a catch
- Bitcoin researchers propose quantum fix that would not crowd out transactions
- Binance co-founders CZ and Yi He adopted Simpsons cartoon aliases ‘Homer’ and ‘Marge’ in company meetings
- Bitcoin below $79,000, XRP leads losses as traders start betting on a Fed hike
- Lesser-tracked bitcoin market dynamic lends credibility to August surge to $80,000
- SEC resurrecting U.S. crypto custody rule the previous administration failed to land
- Russian Influence Network Used ChatGPT to Masquerade as Academic Experts
- Bill Gates Wants a Robot Tax and Jobs Humans Can't Be Fired From
- Nvidia Shares Surge in After-Hours Trading After Record $96.2 Billion Revenue
🔍 Technical Analysis
Bitcoin (BTC) — +0.98%
$79,799.76 52W: $57,747.77 — $97,860.60
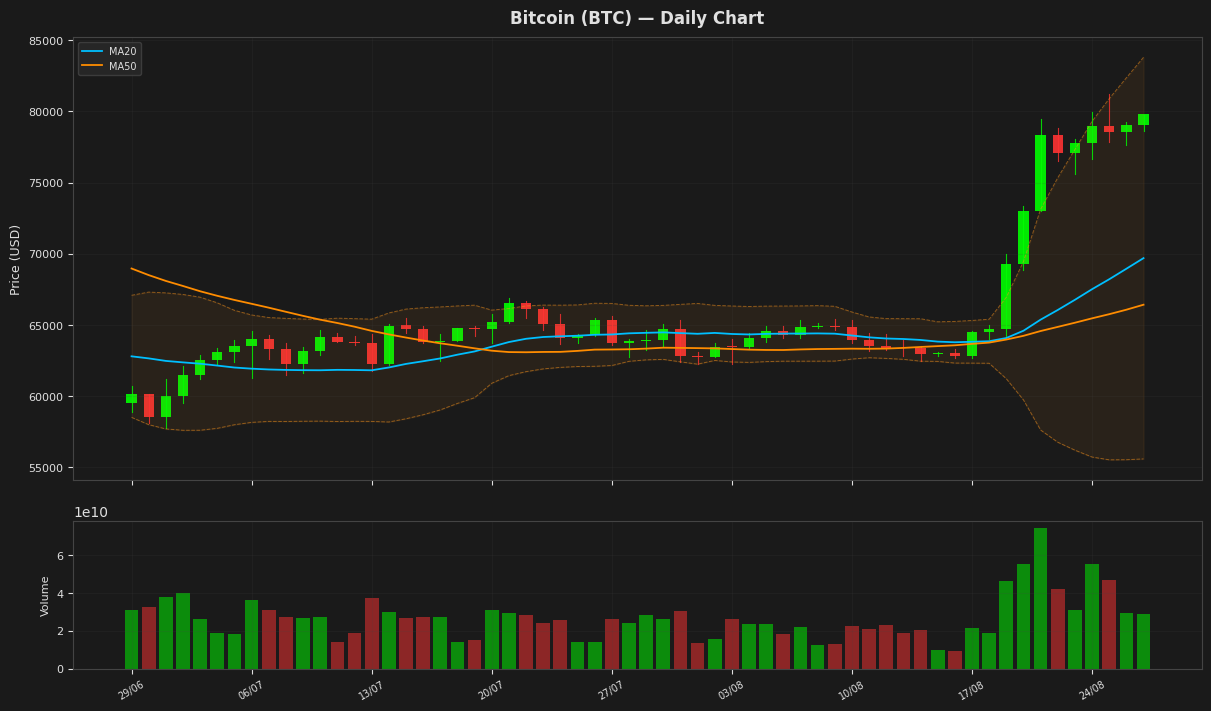
Bitcoin's price is currently near its 52-week high, with a relative strength index (RSI) of 89.11 indicating overbought conditions. The moving averages (MA20 and MA50) are trending upwards, suggesting a bullish trend. The Bollinger Bands show the upper band at $83,798.92, which may act as a resistance level. The MACD is above its signal line, indicating a potential continuation of the uptrend.
Ethereum (ETH) — +1.21%
$2,536.62 52W: $1,506.51 — $3,397.90
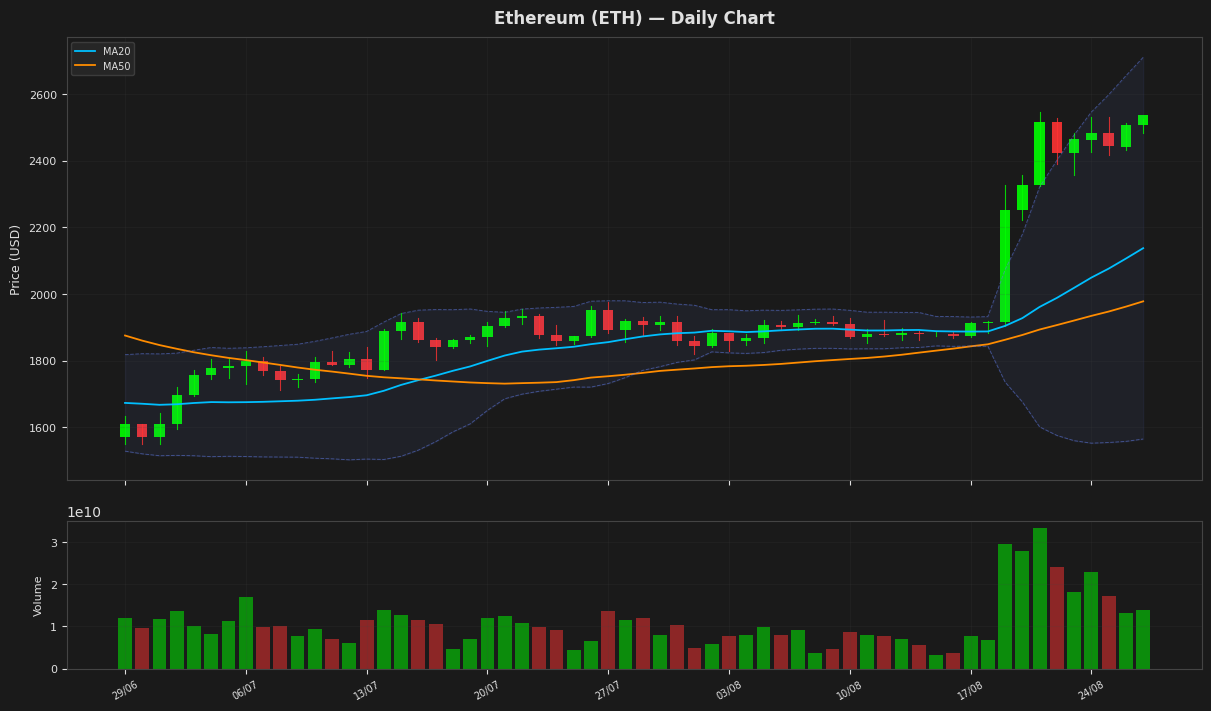
Ethereum's price is currently at $2,536.62, showing a daily increase of 1.21%, and is positioned near the upper Bollinger Band at $2,710.30, indicating a potentially overbought condition as also suggested by the RSI(14) value of 84.99. The MACD is above its signal line, indicating a bullish signal. The ATR(14) suggests high volatility in the Ethereum price.
Ripple (XRP) — +1.02%
$1.4369 52W: $0.988422 — $2.4103
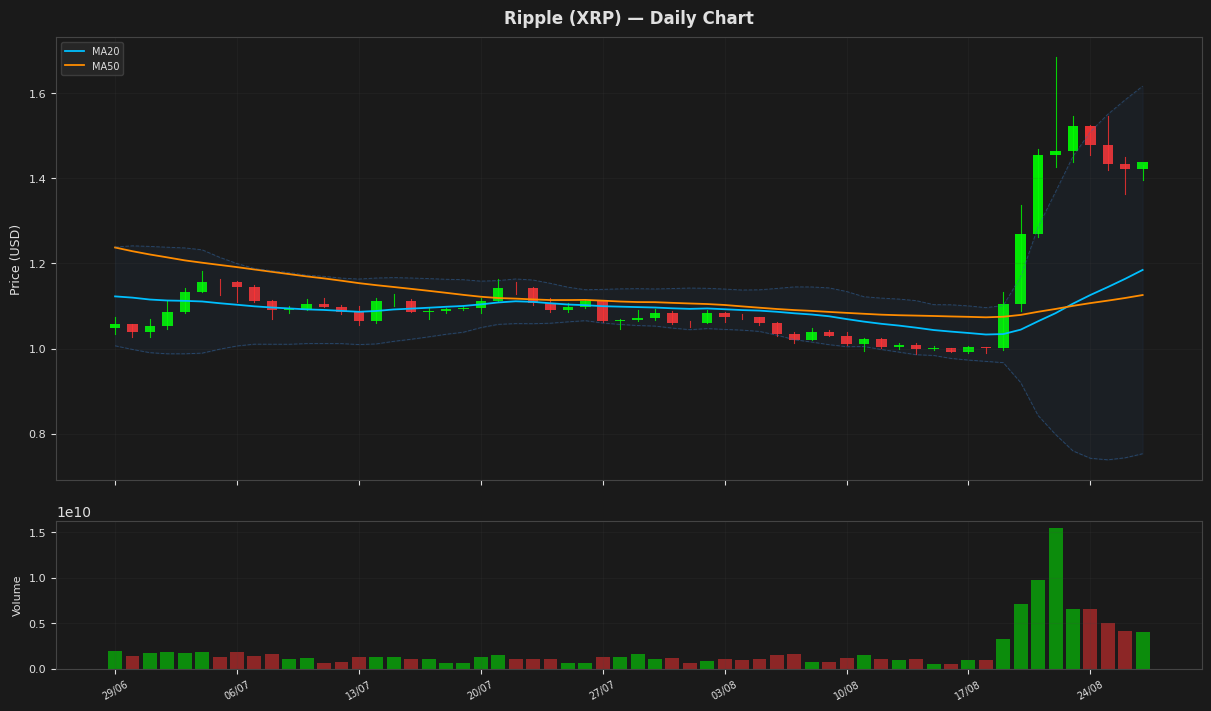
Ripple's price is currently trading near the upper Bollinger Band at $1.436900, indicating a potentially overbought condition as supported by the RSI(14) value of 82.005254. The MACD is above its signal line, suggesting a bullish trend. The price is significantly above both MA20 and MA50, further indicating a strong uptrend. The high RSI value may signal a potential reversal or consolidation.
Solana (SOL) — +2.20%
$104.4200 52W: $60.4147 — $148.2160
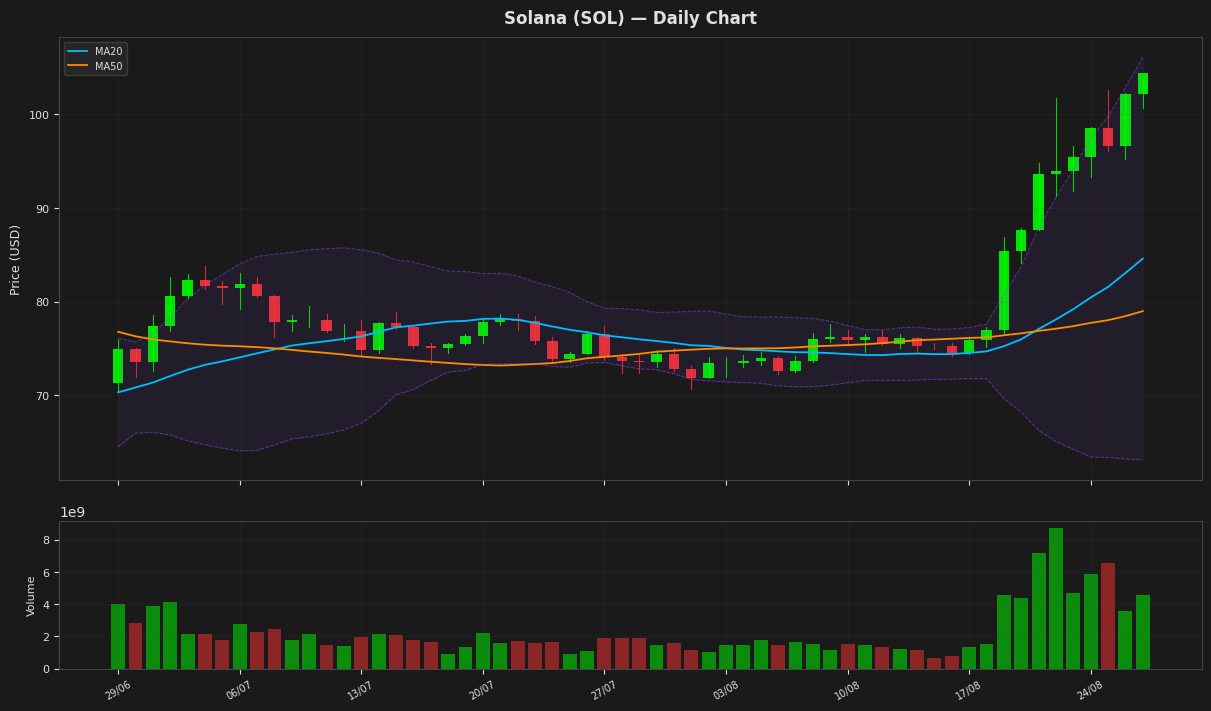
Solana's price is nearing the upper Bollinger Band at $106.051067, indicating a potentially overbought condition, further supported by the RSI(14) value of 89.850769, which is above the typical overbought threshold of 70. The MACD is positive and above its signal line, suggesting a bullish trend. The current price is still above both MA20 and MA50, indicating a strong uptrend.
BNB (BNB) — +0.62%
$712.2600 52W: $538.5992 — $954.8583
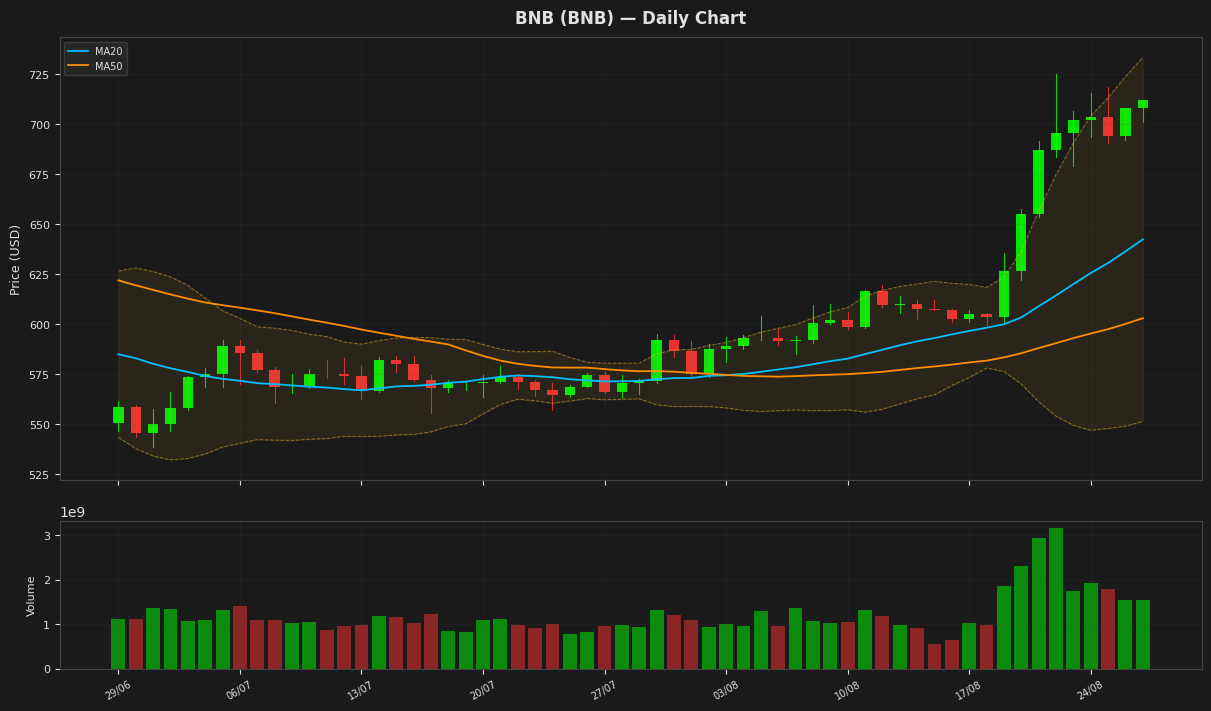
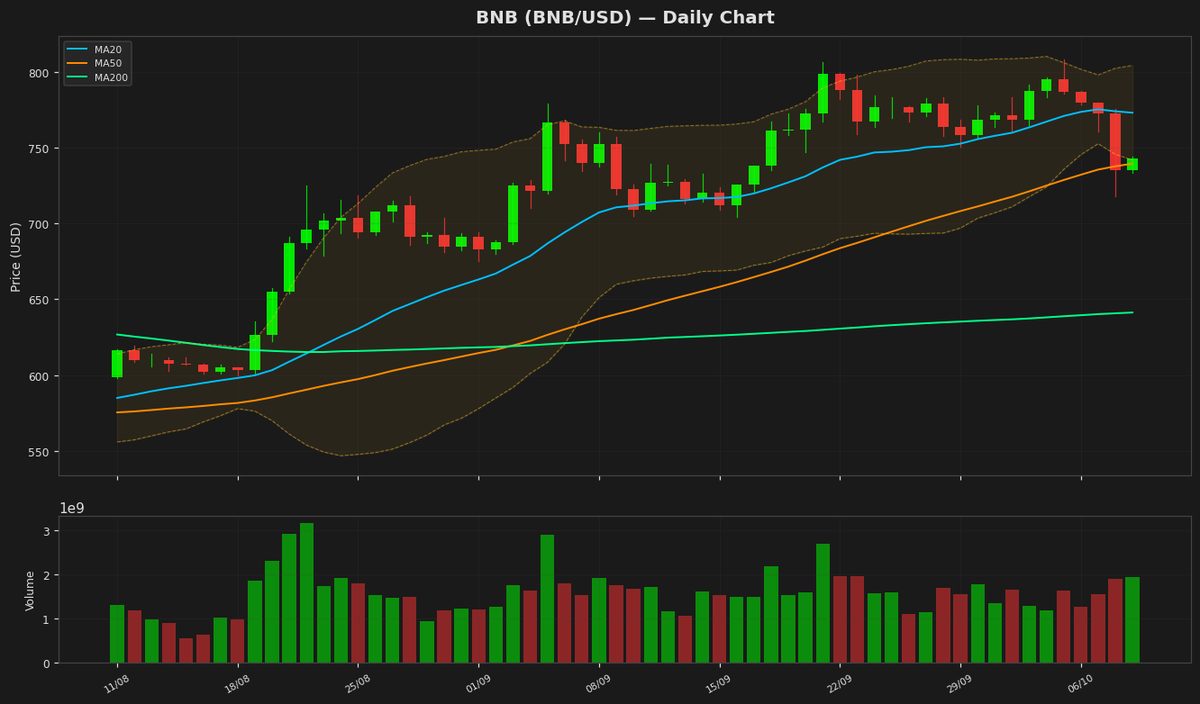
BNB is currently trading at $712.26, showing a slight increase of 0.62% in a day, with its price hovering near the upper Bollinger Band at $733.43, indicating a potentially overbought condition as also suggested by the RSI(14) value of 86.55. The MACD is above its signal line, indicating a bullish signal. The ATR(14) suggests moderate volatility.
Tron (TRX) — -0.13%
$0.335612 52W: $0.268138 — $0.376332
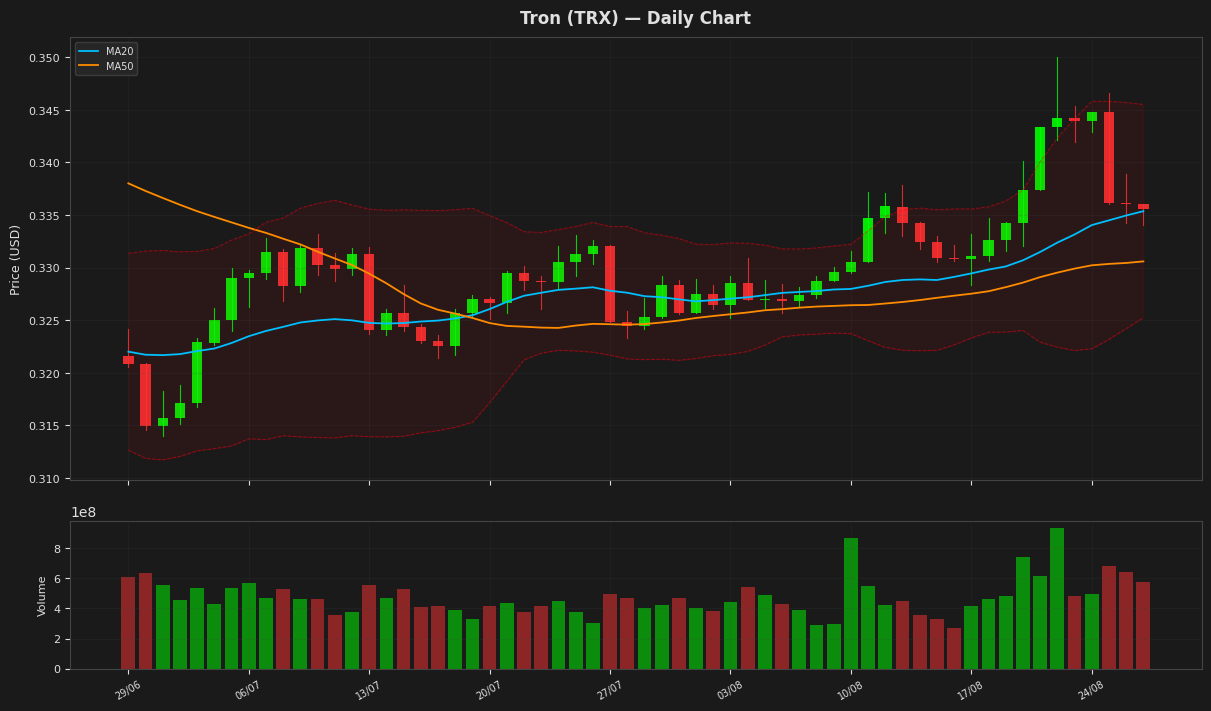
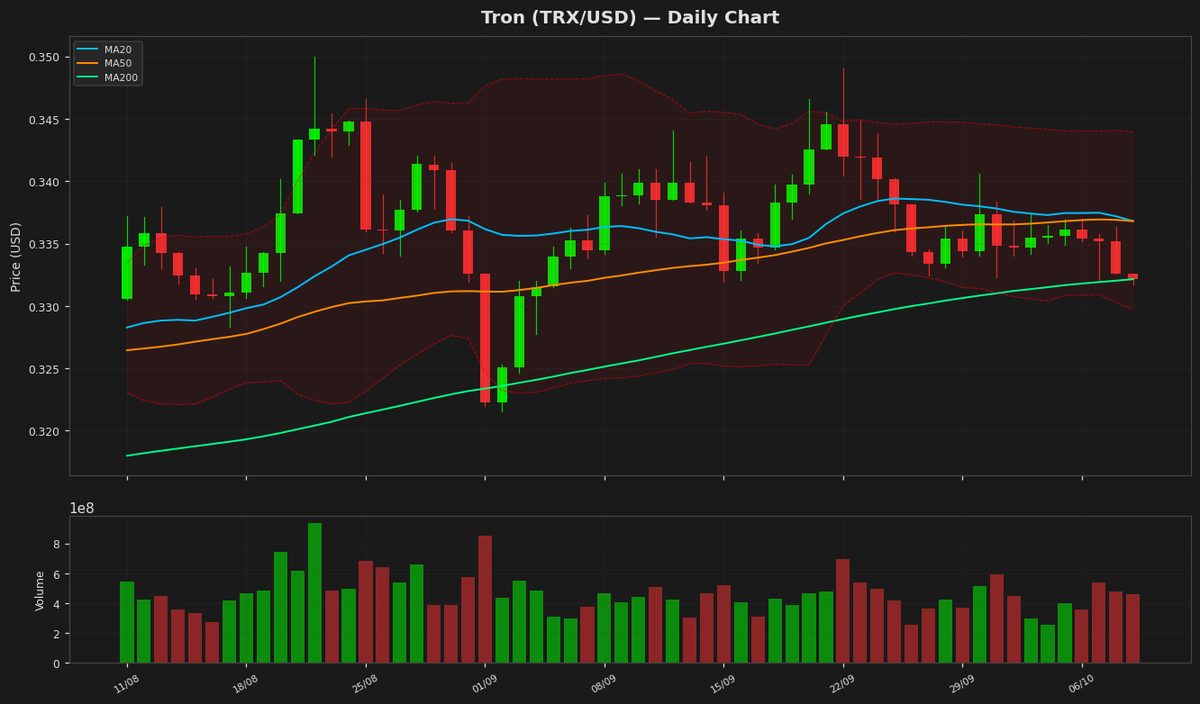
Tron's price is currently at $0.335612, showing a marginal decline of 0.13%. The RSI value of 52.465351 indicates a neutral market sentiment, while the MACD line is slightly below its signal line, suggesting a potential weakening of the upward momentum. The Bollinger Bands suggest that the price is near the upper band at $0.345512, indicating a potential resistance level.
Dogecoin (DOGE) — +1.33%
$0.088910 52W: $0.067973 — $0.156091
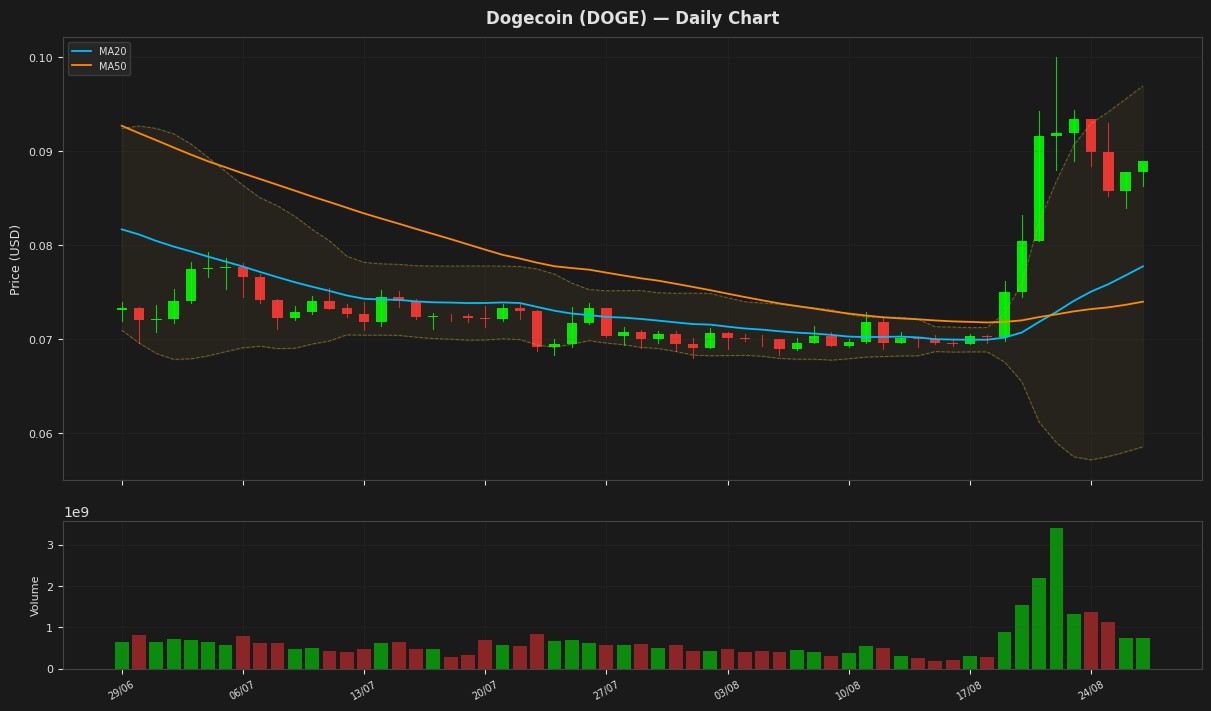
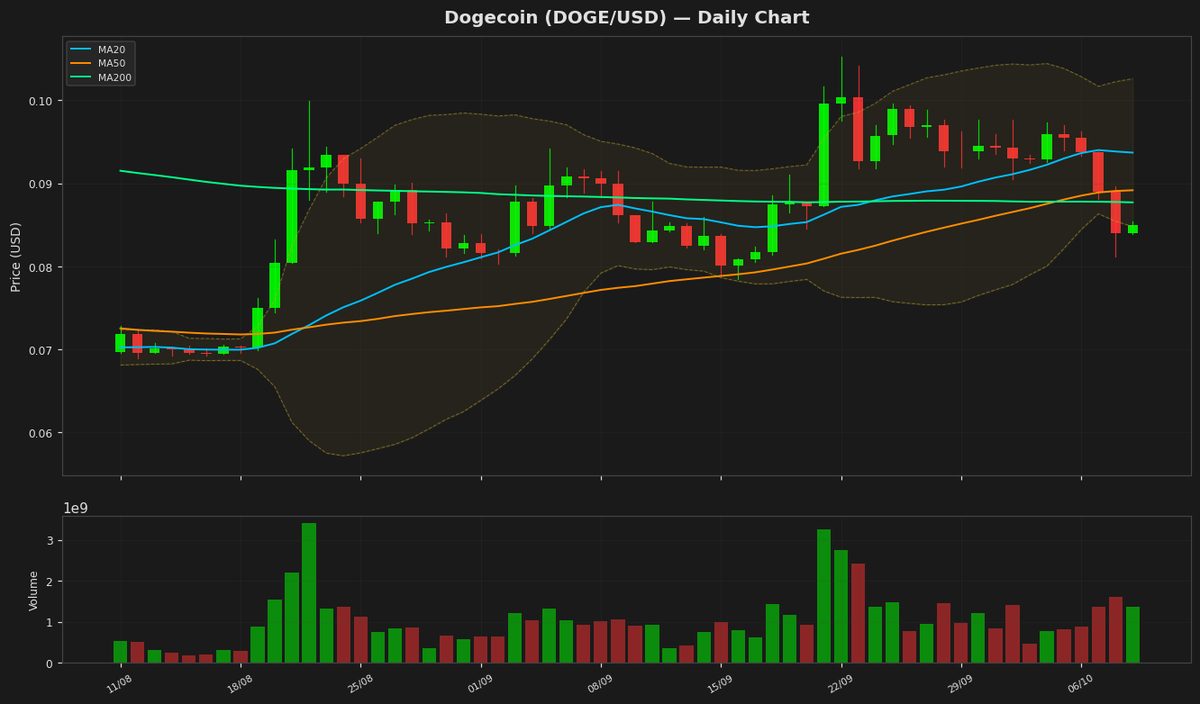
Dogecoin's price is currently trading at $0.088910, showing a daily gain of 1.33% and indicating a bullish trend as it is above both the MA20 and MA50. The RSI is at 76.35, suggesting the cryptocurrency is nearing overbought territory. The MACD is above its signal line, reinforcing the positive momentum. The price is also near the upper Bollinger Band at $0.096945, indicating potential resistance.
Disclaimer
The content on MarketsFN.com is provided for educational and informational purposes only. It does not constitute financial advice or investment recommendations. All investments involve risk. Past performance does not guarantee future results.