Crypto Market Sees Gains: Solana, BNB, and Bitcoin Lead the Rally
QuoteReporter
•5 min read
Crypto Market Sees Gains: Solana, BNB, and Bitcoin Lead the Rally
Crypto Market Report | June 26, 2026
📊 Crypto Market Overview
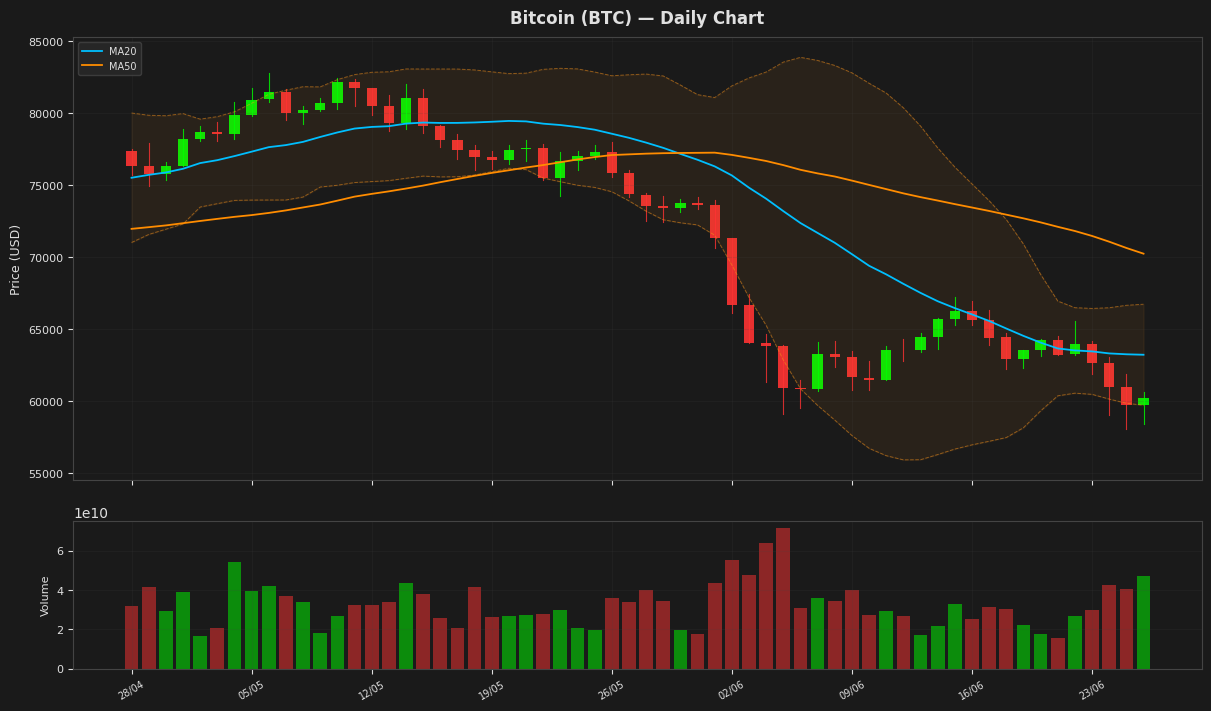
The cryptocurrency market is currently characterized by a mixed sentiment, with some assets experiencing gains while others continue to decline. Bitcoin, the largest cryptocurrency by market capitalization, is trading at $60,217.5781, having risen by 0.83% over the past 24 hours. The Relative Strength Index (RSI) for Bitcoin stands at 38.1, indicating that the asset is approaching oversold territory. The Moving Average Convergence Divergence (MACD) is negative at -2272.8951, suggesting a bearish trend.
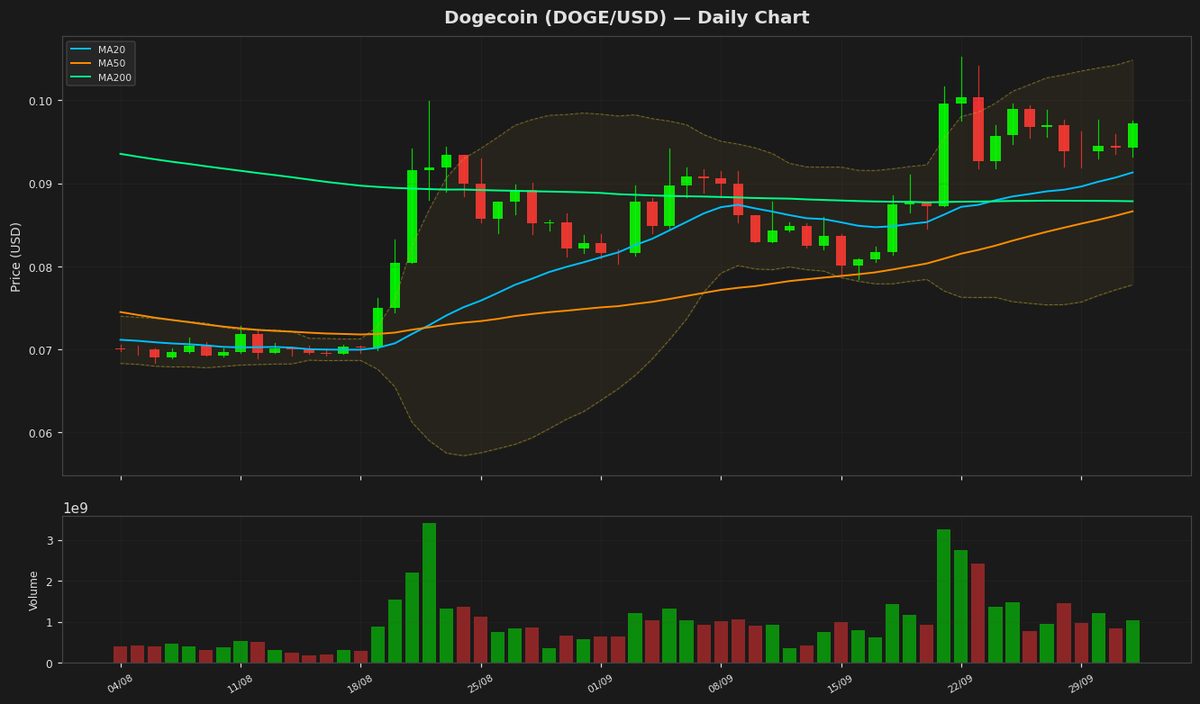
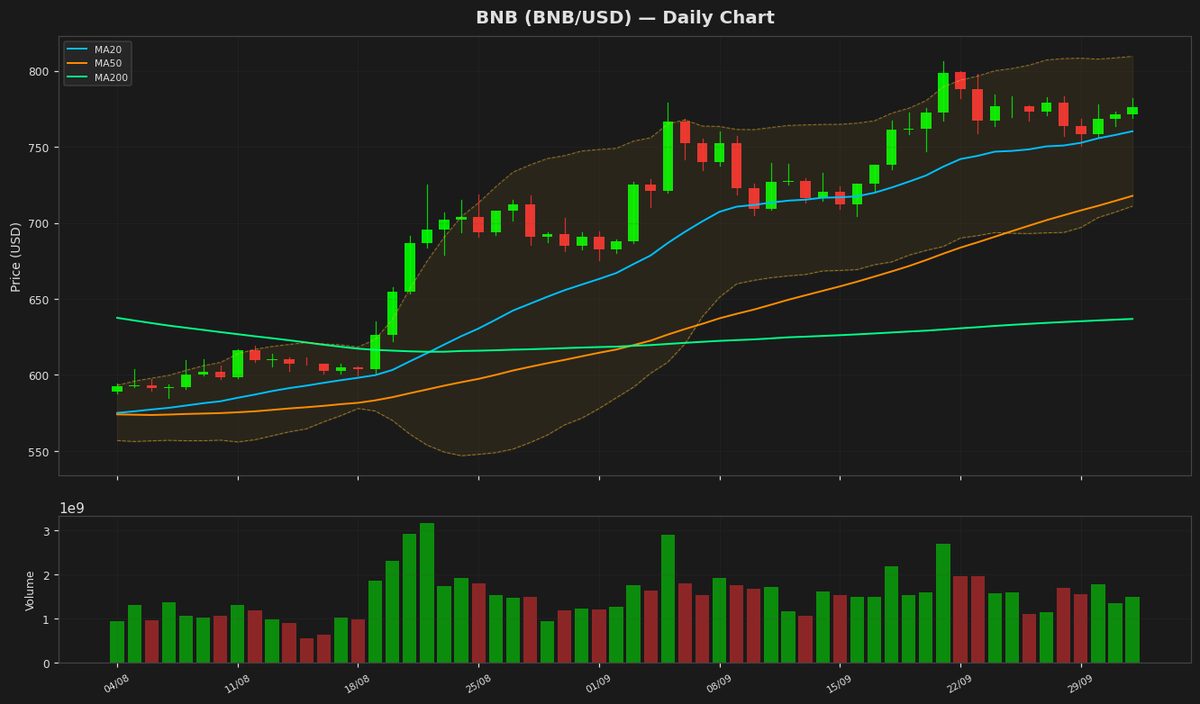
Among the key movers, Solana (SOL) has seen a notable increase of 3.25% to $69.7700, with its RSI at 56.6 and MACD at -1.8150. BNB has also gained 1.34% to $567.2800, with an RSI of 33.6 and a negative MACD of -16.3327. Conversely, Dogecoin (DOGE) has dropped by 0.42% to $0.0745, with an RSI of 17.9, indicating it is deeply oversold, and a MACD of -0.0048.
The broader macro context remains relevant, with the recent news that Tether's stablecoin has surpassed Ether in market capitalization as ETH prices fell to around $1,570. This development is part of a larger trend where stablecoins are gaining prominence. Other news includes a $2.9 million theft from Polymarket, with users set to be refunded, and Coinbase's Base experiencing a 2-hour outage before resuming block production.
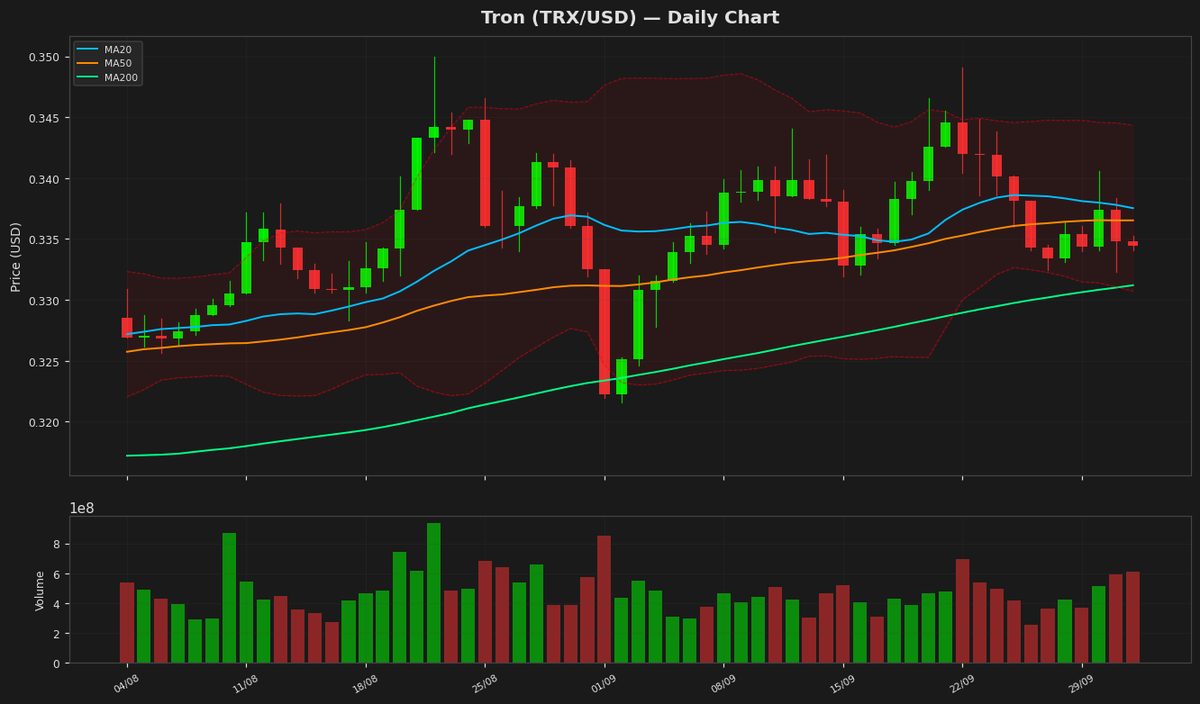
Technically, several cryptocurrencies are exhibiting notable signals. Ethereum's RSI is at 39.9, and its MACD is negative at -78.1000, indicating a bearish trend. Ripple (XRP) and Tron (TRX) are also showing mixed signals, with XRP's RSI at 36.3 and TRX's RSI at 58.5. Overall, the market is displaying a complex picture, with various assets reacting to different factors and technical indicators suggesting a range of potential outcomes.
Among the key movers, Solana (SOL) has seen a notable increase of 3.25% to $69.7700, with its RSI at 56.6 and MACD at -1.8150. BNB has also gained 1.34% to $567.2800, with an RSI of 33.6 and a negative MACD of -16.3327. Conversely, Dogecoin (DOGE) has dropped by 0.42% to $0.0745, with an RSI of 17.9, indicating it is deeply oversold, and a MACD of -0.0048.
The broader macro context remains relevant, with the recent news that Tether's stablecoin has surpassed Ether in market capitalization as ETH prices fell to around $1,570. This development is part of a larger trend where stablecoins are gaining prominence. Other news includes a $2.9 million theft from Polymarket, with users set to be refunded, and Coinbase's Base experiencing a 2-hour outage before resuming block production.
Technically, several cryptocurrencies are exhibiting notable signals. Ethereum's RSI is at 39.9, and its MACD is negative at -78.1000, indicating a bearish trend. Ripple (XRP) and Tron (TRX) are also showing mixed signals, with XRP's RSI at 36.3 and TRX's RSI at 58.5. Overall, the market is displaying a complex picture, with various assets reacting to different factors and technical indicators suggesting a range of potential outcomes.
📰 Crypto News
- Polymarket hit by $2.9M theft, users to be refunded
- Here’s what happened in crypto today
- Tether stablecoin flips Ether by market cap as ETH routs to $1.5K
- Coinbase's Base resumes block production after 2-hour outage
- Sharplink buys ETH after 8-month pause as token hits 2026 low
- StablecoinX bets on Ethena ecosystem with Nasdaq debut
- BitGo cuts 15% of staff to sharpen focus on AI, stablecoins
- Does Botanix’s failure prove Bitcoiners don’t care about DeFi?
- Bitcoin bounces off new 2026 price lows: Will US stock weakness push BTC lower?
- Grant Cardone says he will keep buying bitcoin using real estate cash flows
- Too big to fail: Strategy’s $13 billion bitcoin paper loss alone dwarfs hundreds of prominent tokens
- Ether, XRP and dogecoin lead a broad crypto selloff as tech stocks tumble
- Live markets: Bitcoin rebounds to nearly $60,000. Kospi, Nikkei sink
- Asset management giant Invesco files for tokenized fund targeting stablecoin reserve market
- Anthropic Urges Congress to Crack Down on AI Distillation By Chinese Rivals
🔍 Technical Analysis
Bitcoin (BTC) — +0.83%
$60,217.58 52W: $58,075.92 — $116,273.31
Bitcoin's price is currently at $60,217, slightly above the lower band of the Bollinger Bands at $59,718, indicating potential support. The RSI is at 38.06, suggesting the asset is nearing oversold territory. The MACD is below its signal line, indicating a bearish trend. The price is also below both the MA20 and MA50, further reinforcing the bearish sentiment.
Ethereum (ETH) — +0.36%
$1,570.46 52W: $1,506.51 — $4,250.67
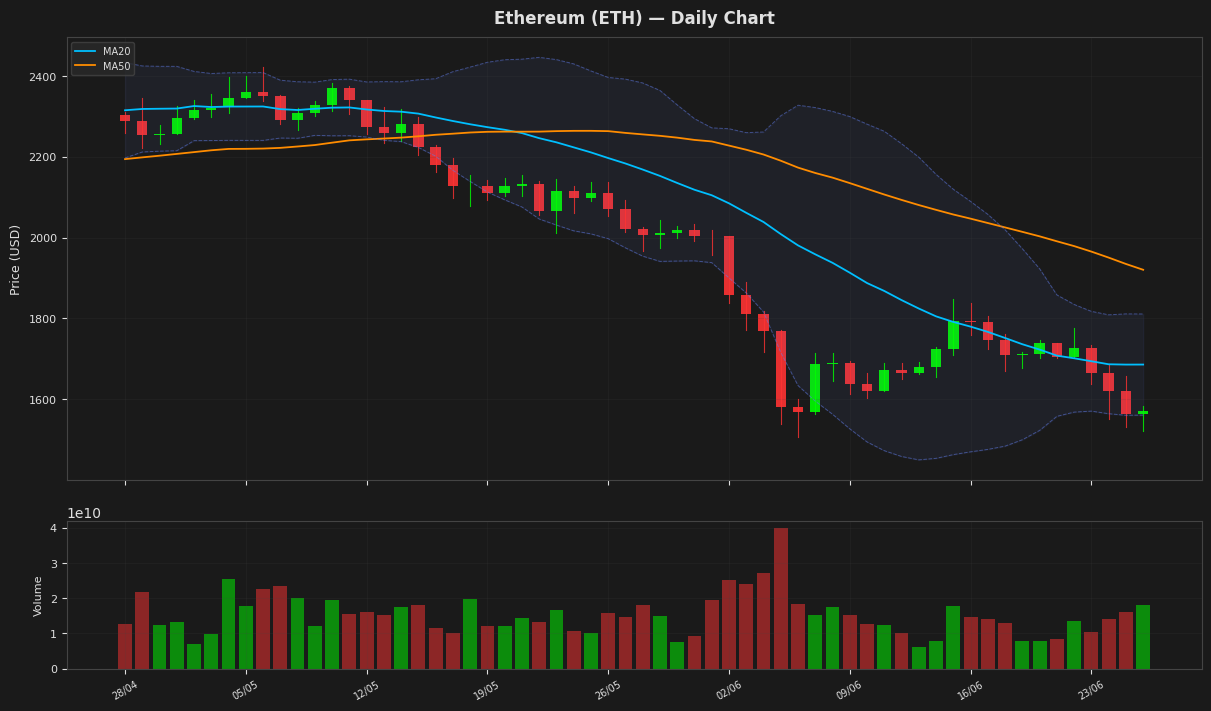
Ethereum's price is currently at $1,570.46, near the lower Bollinger Band at $1,561.03, indicating potential support. The RSI is at 39.91, suggesting the asset is approaching oversold territory. The MACD is slightly below its signal line, indicating a potential bearish trend continuation. The price is also below both MA20 and MA50, further indicating a bearish sentiment.
Ripple (XRP) — -0.25%
$1.0390 52W: $1.0108 — $2.6934
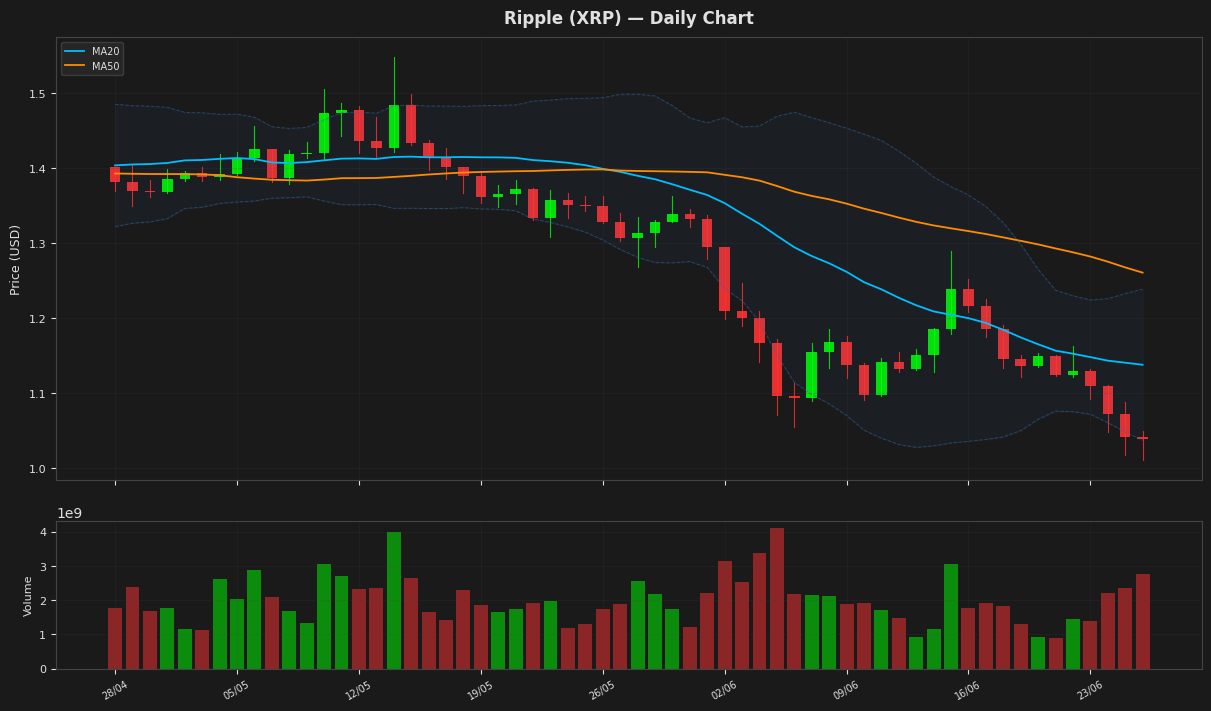
Ripple's current price is $1.039, near the lower Bollinger Band at $1.036729, indicating potential support. The RSI is at 36.27963, suggesting the asset is approaching oversold territory. The MACD is below its signal line, indicating a bearish trend. The price is also below both MA20 and MA50, further reinforcing the bearish sentiment.
Solana (SOL) — +3.25%
$69.7700 52W: $60.4147 — $205.0200
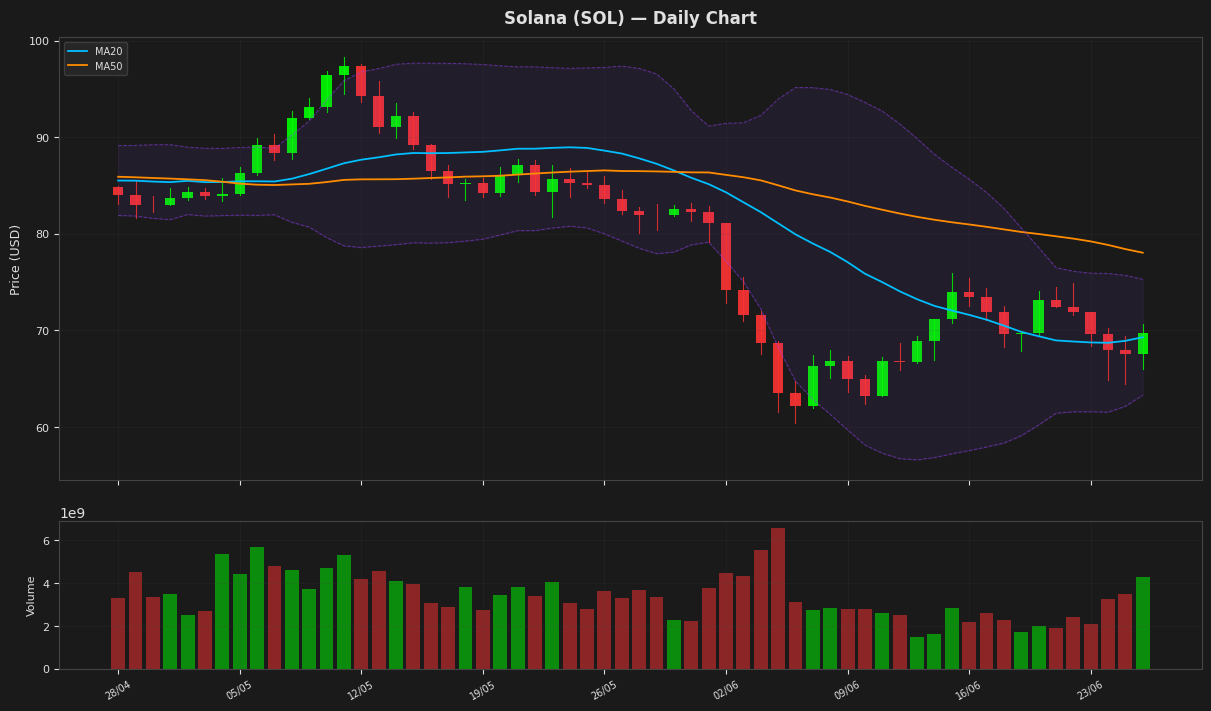
Solana's price is currently at $69.77, showing a 3.25% daily gain, and is near its 20-day moving average of $69.30. The RSI at 56.59 indicates a neutral momentum, while the MACD is above its signal line, suggesting a potential bullish crossover. The price is also within the Bollinger Bands, with the upper band at $75.29 and lower band at $63.31, indicating moderate volatility.
BNB (BNB) — +1.34%
$567.2800 52W: $543.1838 — $1,180.01
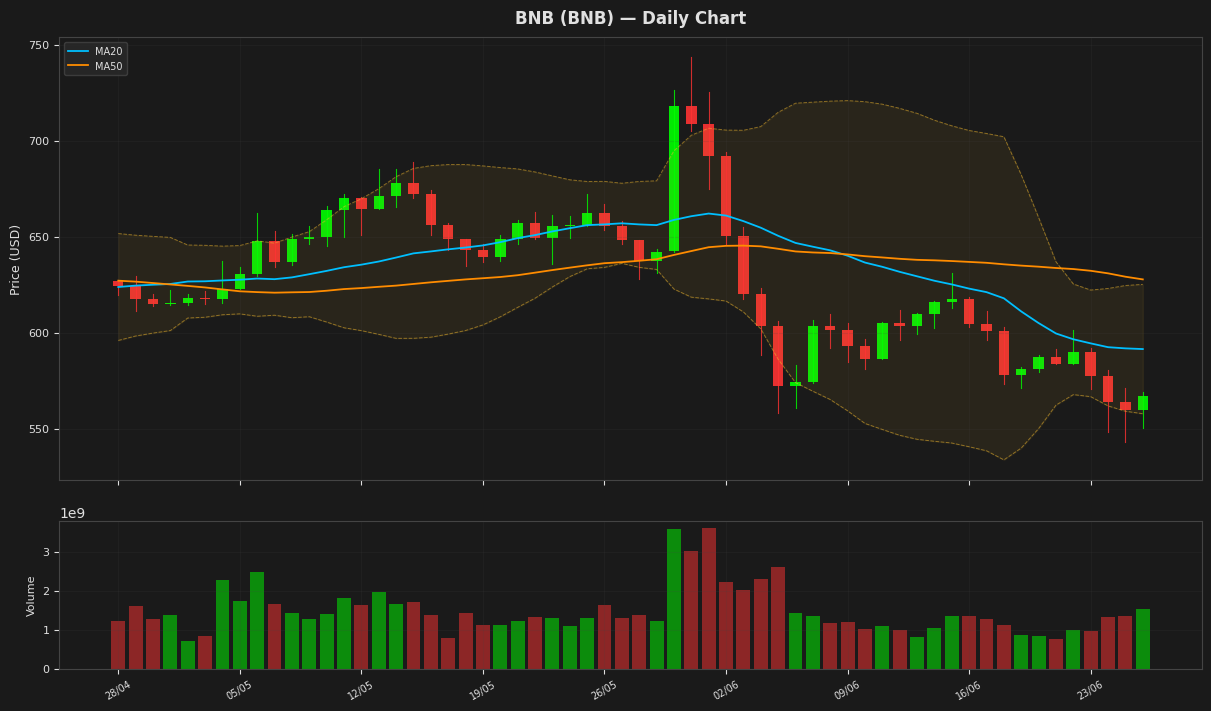
BNB is currently trading at $567.28, near its 52-week low of $543.18, with an RSI of 33.62 indicating oversold conditions. The price is also close to the lower Bollinger Band at $557.84, suggesting potential support. The MACD is below its signal line, indicating a bearish trend, but the small gap between the two lines suggests a possible reversal. The ATR indicates moderate volatility.
Tron (TRX) — -0.45%
$0.321949 52W: $0.268138 — $0.376332
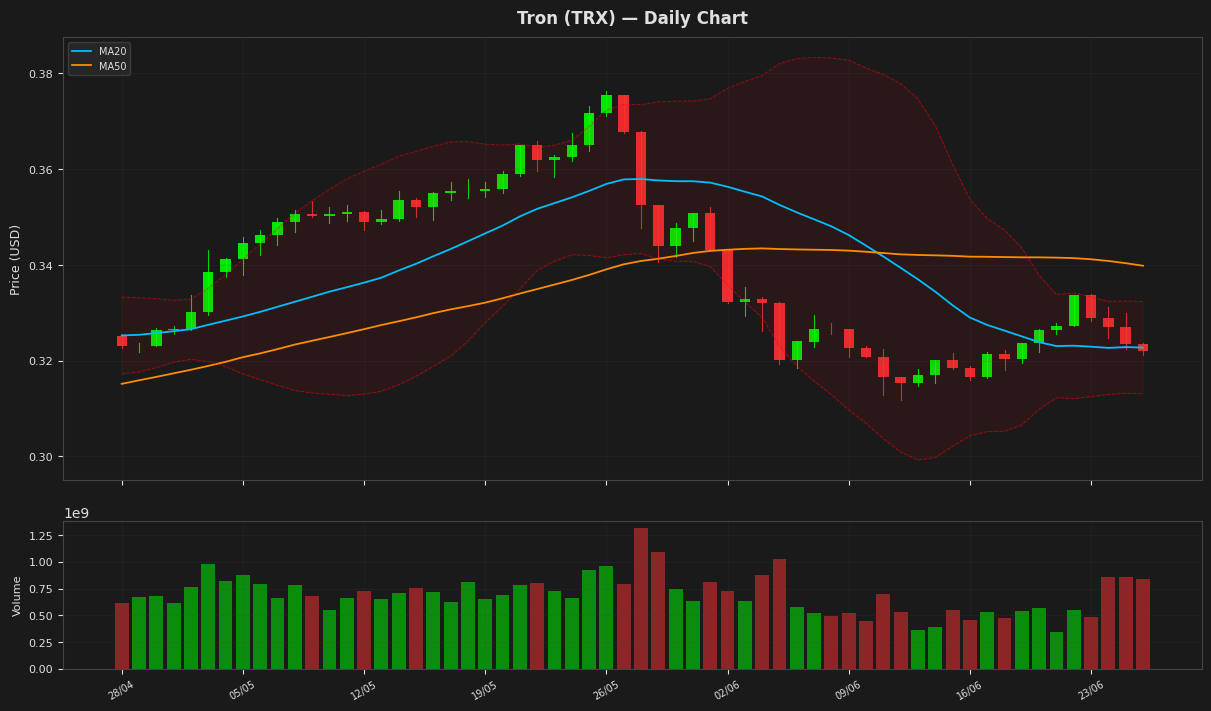
Tron's price is currently at $0.321949, showing a minor decline of 0.45% in a day, and is positioned near the middle of the Bollinger Bands. The RSI of 58.515905 indicates a neutral to slightly bullish sentiment, while the MACD line is above its signal line, suggesting a potential bullish crossover. The price is below both the MA20 and MA50, indicating a downtrend in the short to medium term.
Dogecoin (DOGE) — -0.42%
$0.074470 52W: $0.072059 — $0.209315
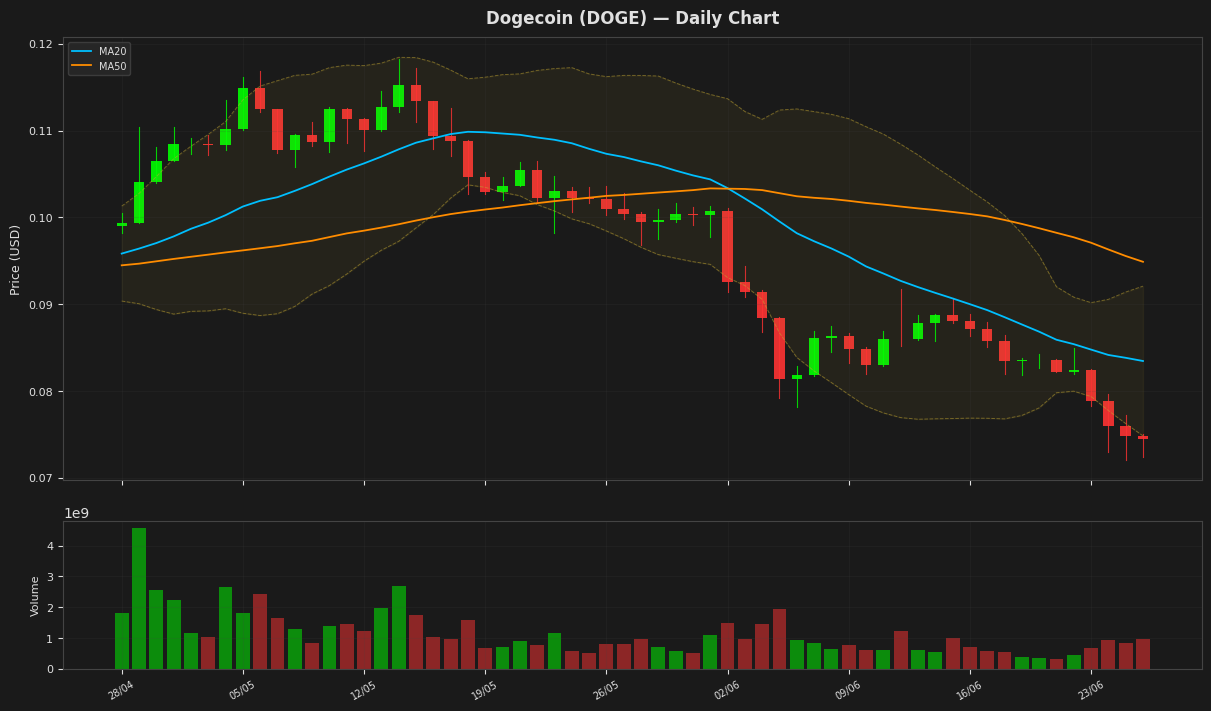
Dogecoin's price is currently at $0.074470, near the lower Bollinger Band at $0.074824, indicating a potential oversold condition supported by the RSI(14) value of 17.908187, which is below 20. The MACD is below its signal line, suggesting a bearish trend. The price is also below both MA20 and MA50, further indicating a downtrend.
Disclaimer
The content on MarketsFN.com is provided for educational and informational purposes only. It does not constitute financial advice or investment recommendations. All investments involve risk. Past performance does not guarantee future results.