Crypto Market Sees Gains: Ripple, Dogecoin, and Ethereum Lead the Charge
QuoteReporter
•5 min read
Crypto Market Report | October 09, 2026
📊 Crypto Market Overview
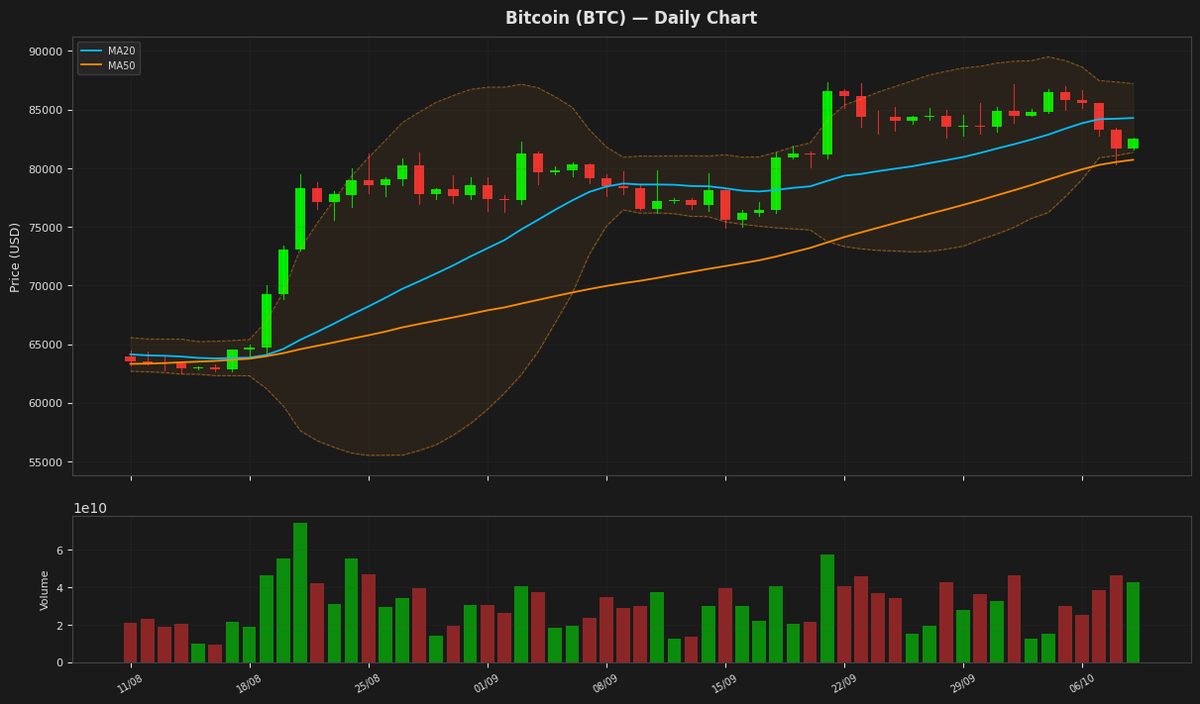
The cryptocurrency market is currently displaying a mixed sentiment, with some assets showing modest gains while others remain relatively stable. Bitcoin is trading at $82,485.54, having risen by 0.99% today, with its RSI indicating a neutral level of 42.8. The MACD stands at 1129.3285, suggesting a continued bullish underlying trend. Ethereum, on the other hand, has gained 1.03% and is priced at $2,497.42, with an RSI of 27.6 that suggests it is oversold, and a MACD of 14.0166 indicating a potential for recovery.
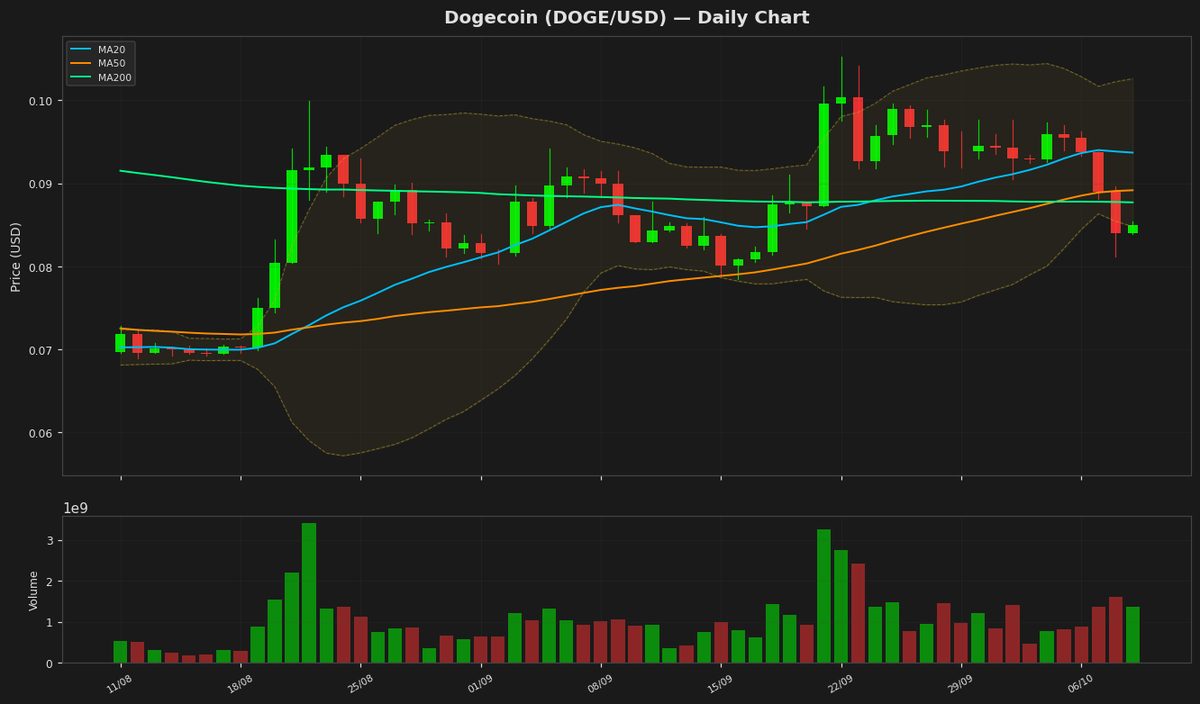
Other notable assets have also shown varying degrees of movement. Ripple has increased by 1.52% to $1.3999, with an RSI of 21.1 that indicates it is oversold. Solana is up 0.56% at $110.06, with an RSI of 22.9, also suggesting oversold conditions. Dogecoin has risen by 1.22% to $0.0851, with an RSI of 20.8, indicating it is deeply oversold.
The macroeconomic context is influencing the crypto market, with news of outflows from Bitcoin and Ether ETFs reaching towards $1 billion in October. Meanwhile, Thailand has finalized rules to allow for Bitcoin and Ether ETFs, potentially paving the way for increased investment in the region. The technical landscape is also noteworthy, with several assets displaying oversold conditions on their RSI indicators, while their MACD values suggest varying degrees of momentum. Solana is set to undergo a significant upgrade that will halve its block times, potentially enhancing its scalability and usability. Overall, the market is characterized by a mix of modest gains, oversold conditions, and significant technological developments that could impact the trajectory of various cryptocurrencies.
Other notable assets have also shown varying degrees of movement. Ripple has increased by 1.52% to $1.3999, with an RSI of 21.1 that indicates it is oversold. Solana is up 0.56% at $110.06, with an RSI of 22.9, also suggesting oversold conditions. Dogecoin has risen by 1.22% to $0.0851, with an RSI of 20.8, indicating it is deeply oversold.
The macroeconomic context is influencing the crypto market, with news of outflows from Bitcoin and Ether ETFs reaching towards $1 billion in October. Meanwhile, Thailand has finalized rules to allow for Bitcoin and Ether ETFs, potentially paving the way for increased investment in the region. The technical landscape is also noteworthy, with several assets displaying oversold conditions on their RSI indicators, while their MACD values suggest varying degrees of momentum. Solana is set to undergo a significant upgrade that will halve its block times, potentially enhancing its scalability and usability. Overall, the market is characterized by a mix of modest gains, oversold conditions, and significant technological developments that could impact the trajectory of various cryptocurrencies.
📰 Crypto News
- Bitcoin, Ether ETFs’ October outflows swell toward $1B
- Here’s what happened in crypto today
- Crypto projects apply for Anthropic’s new frontier AI security scanner
- Trump administration outlines quantum, AI initiatives in $6B science push
- Thailand finalizes rules paving way for Bitcoin, Ether ETFs
- Cantor Fitzgerald faces Senate Democrat’s questions over Tether ties
- China’s P2P stablecoin wallets surge 43x, Korea’s $450B crypto economy: Asia Express
- Live updates: XRP ETFs the only ones in green as BTC, ETH, ZEC funds post outflows
- New tech to power bitcoin lending is set to debut with $500 million in commitments
- Solana is about to halve its block times as final 200-millisecond upgrade nears
- XRP Ledger adds new controls for banks, stablecoins and tokenized funds
- Ether bets were wiped out at six times bitcoin’s rate in crypto’s $1 billion flush
- Bitcoin rebounds to $82,000 as Trump rules out Iran strikes, oil drops
- Top Democrat among Senate investigators probes ties between Cantor Fitzgerald, Tether
- AI Startup Manus Raises $500 Million After China Nixed Meta’s $2 Billion Acquisition
🔍 Technical Analysis
Bitcoin (BTC) — +0.99%
$82,485.54 52W: $57,747.77 — $87,363.76
Bitcoin is currently trading at $82,485.54 with a slight increase of 0.99% in a day, near its 20-day moving average of $84,281.72, indicating a consolidation phase. The RSI at 42.84 suggests that the asset is nearing oversold territory, while the MACD below its signal line indicates a potential bearish trend. The price is also within the Bollinger Bands, with the upper and lower bands at $87,215.09 and $81,348.35 respectively.
Ethereum (ETH) — +1.03%
$2,497.42 52W: $1,506.51 — $2,805.50
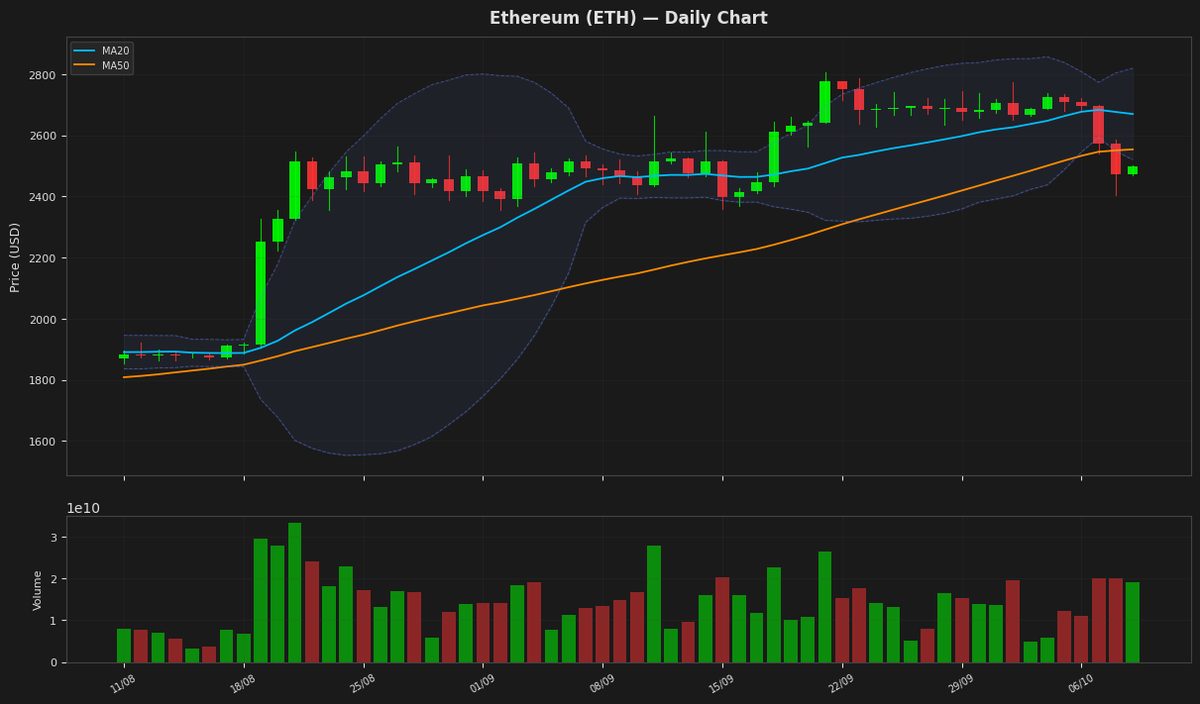
Ethereum is currently trading at $2,497.42, near the lower end of its recent trading range, with the price hovering just below the middle of its 20-day and 50-day moving averages. The RSI is at 27.62, indicating oversold conditions, while the MACD is below its signal line, suggesting a potential for a bounce. The Bollinger Bands indicate that the price is near the lower band at $2,520.24, suggesting a possible support level. The ATR indicates moderate volatility.
Ripple (XRP) — +1.52%
$1.3999 52W: $0.988422 — $1.7492
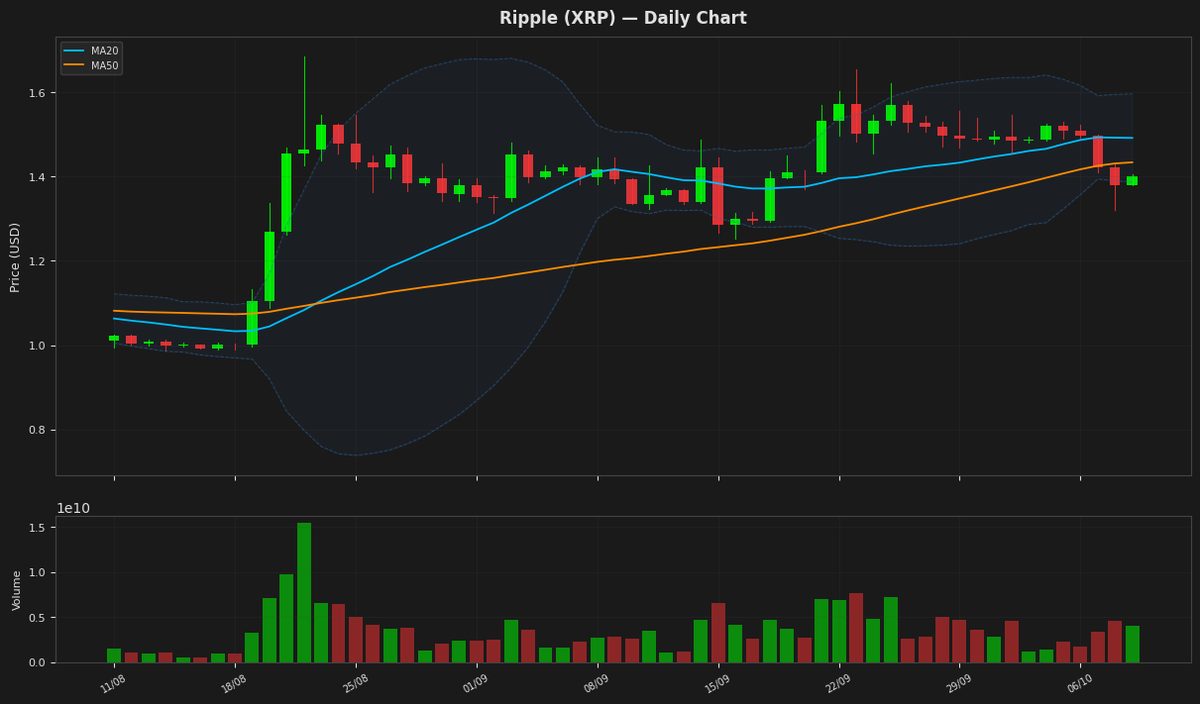
Ripple's price is currently at $1.399900, showing a daily gain of 1.52%, and is positioned near the lower band of the Bollinger Bands at 1.386975, indicating potential support. The RSI is at 21.144134, suggesting oversold conditions. The MACD is below its signal line, indicating a potential bearish signal. The price is also below both the MA20 and MA50, indicating a short-term downtrend.
Solana (SOL) — +0.56%
$110.0600 52W: $60.4147 — $124.6174
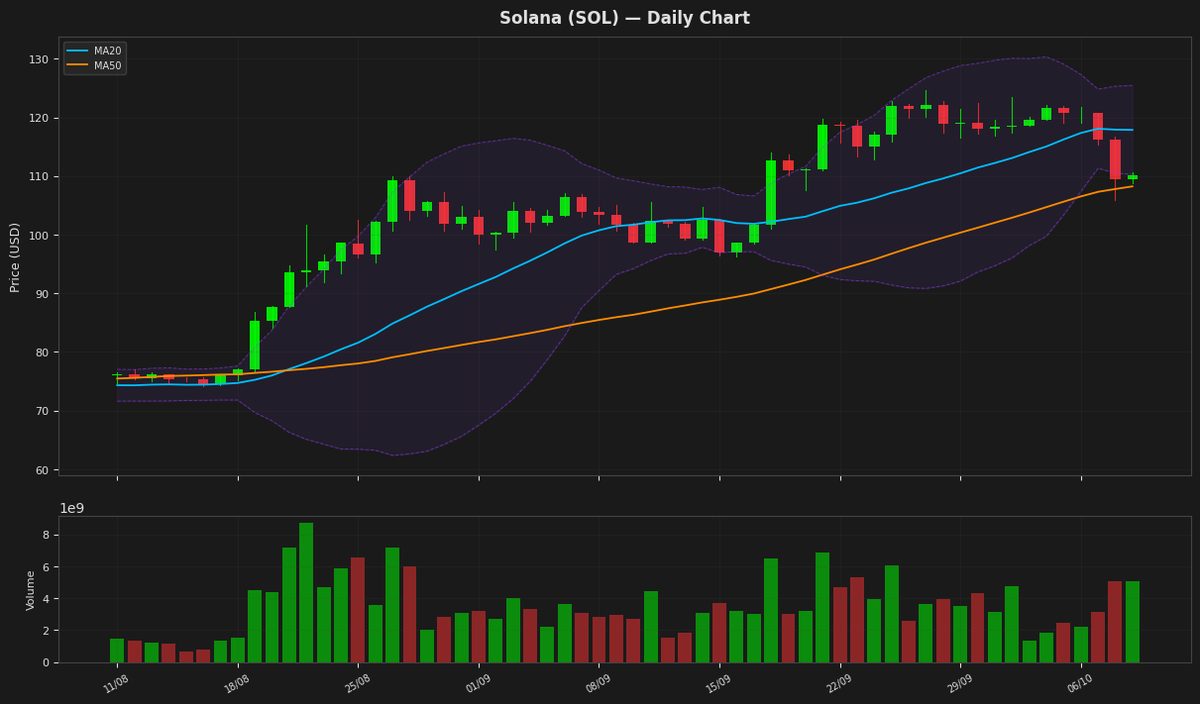
Solana is currently trading at 110.06, positioned slightly below its MA20 of 117.86 but maintaining support above the MA50 of 108.23. The RSI of 22.88 indicates an oversold condition, while the price is testing the lower Bollinger Band at 110.26. Despite a positive MACD, the signal line remains higher, suggesting a bearish momentum that may precede a potential reversal.
BNB (BNB) — +0.91%
$741.8300 52W: $538.5992 — $858.8644
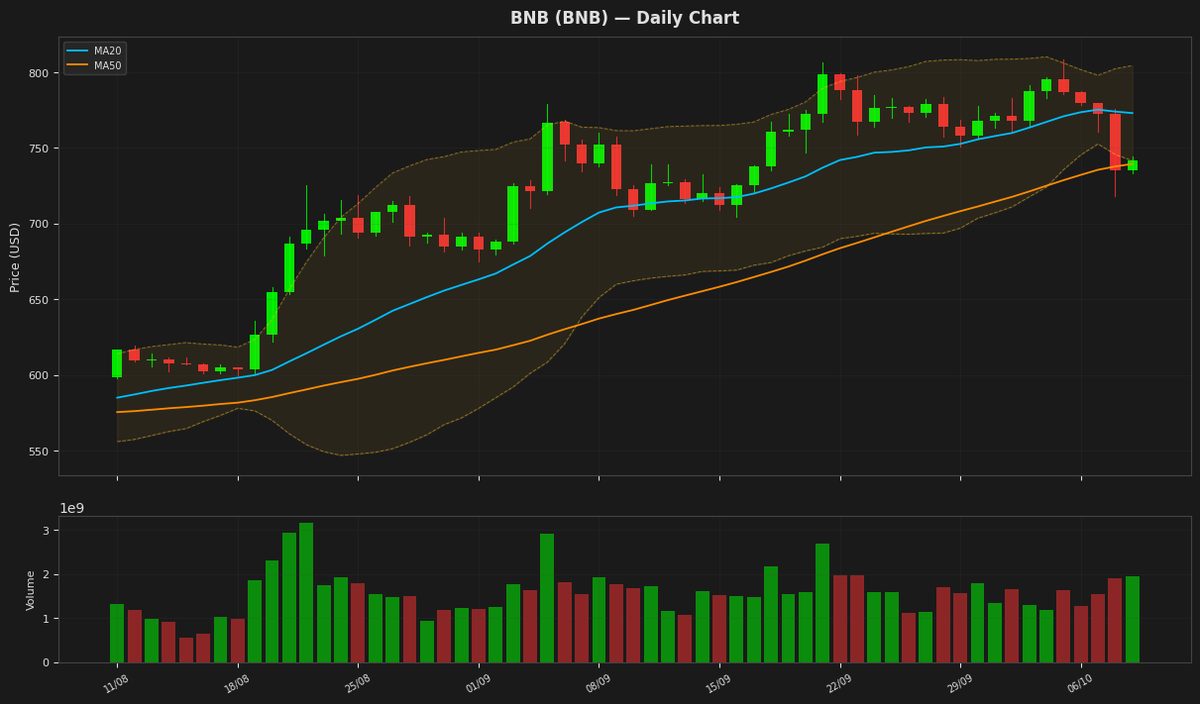
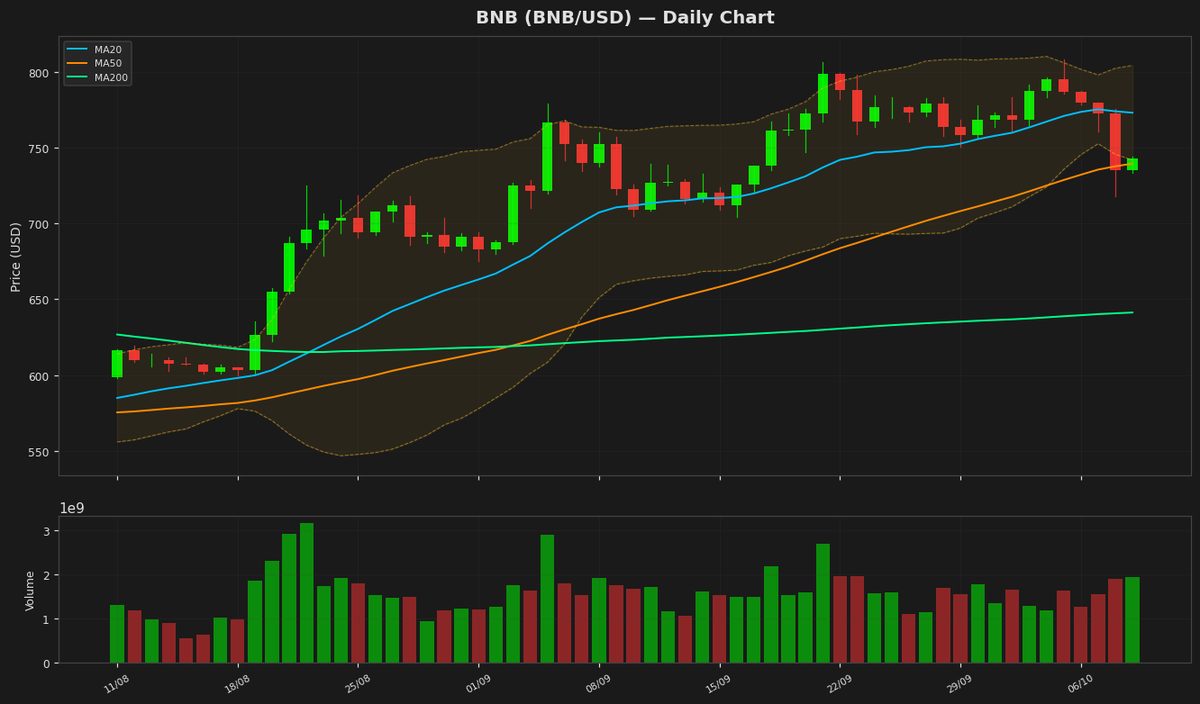
BNB is currently trading at $741.83, near its 20-day moving average of $772.98, and is also close to the lower Bollinger Band at $741.56, indicating potential support. The RSI is at 37.52, suggesting the asset is nearing oversold territory. The MACD is below its signal line, indicating a bearish trend, but the histogram is not strongly negative, suggesting a possible stabilization.
Tron (TRX) — -0.17%
$0.331983 52W: $0.268138 — $0.376332
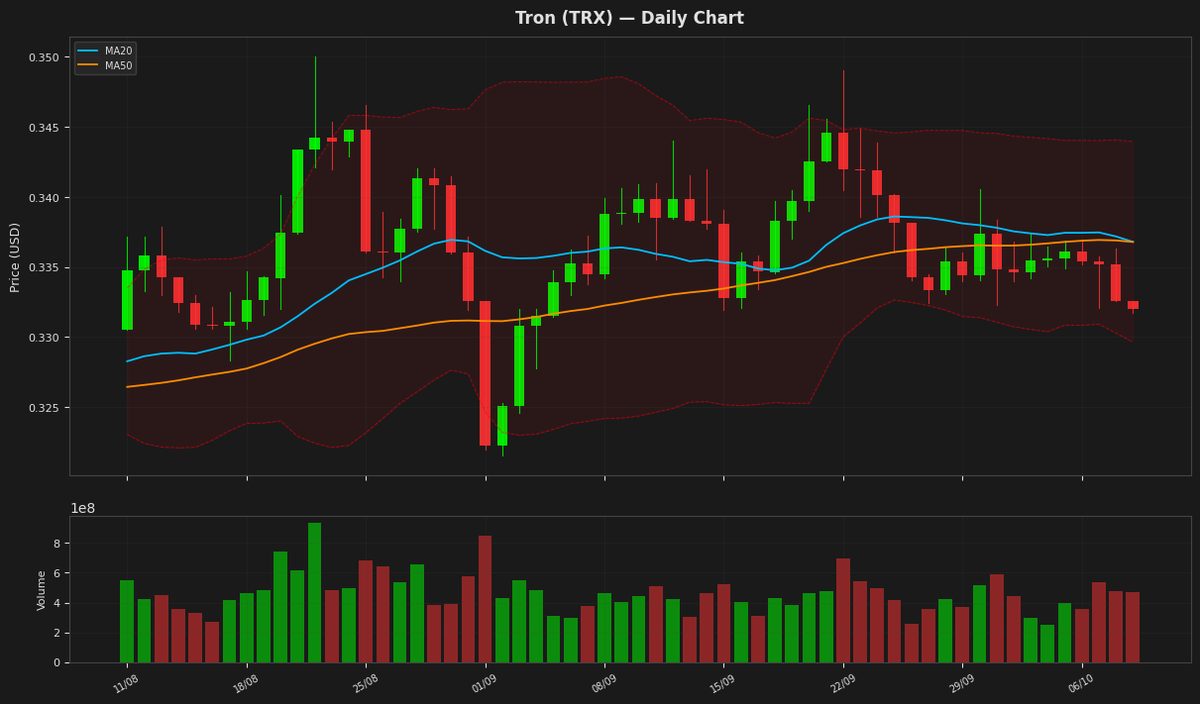
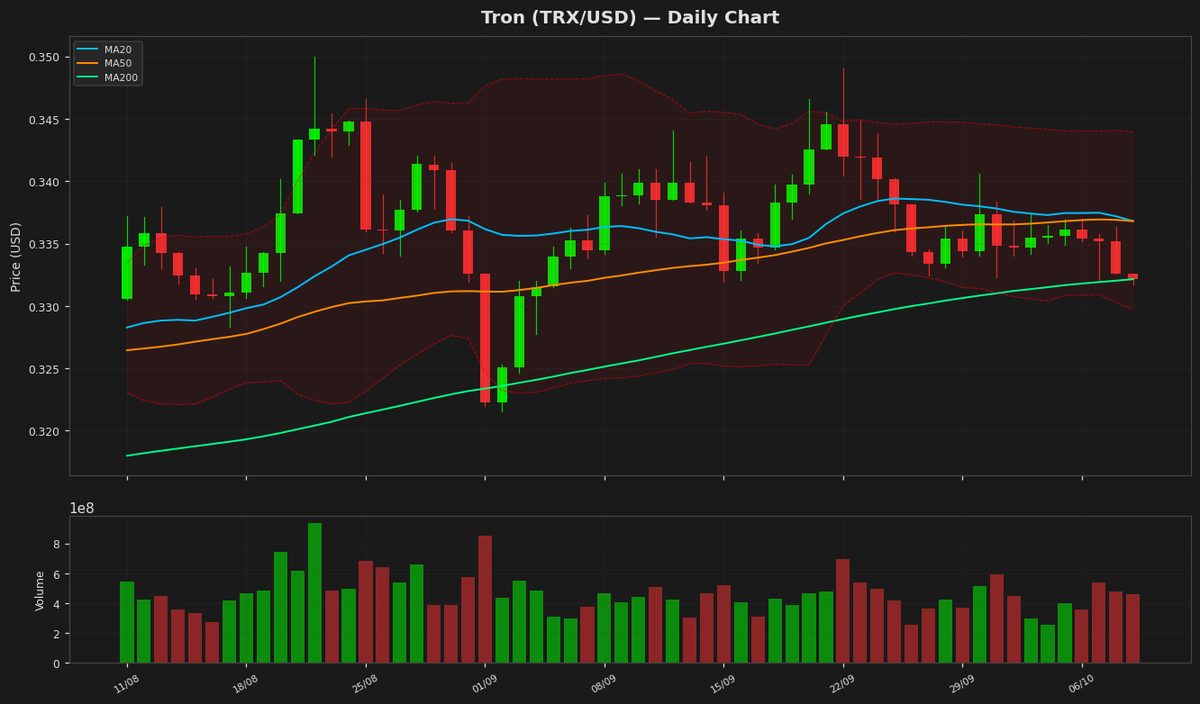
Tron's price is currently at $0.331983, showing a minor decline, and is positioned near the lower band of the Bollinger Bands at $0.329641, indicating potential support. The RSI is at 33.843259, suggesting the asset is approaching oversold territory. The MACD is below its signal line, indicating a bearish signal, while the ATR indicates low volatility.
Dogecoin (DOGE) — +1.22%
$0.085060 52W: $0.067973 — $0.118255
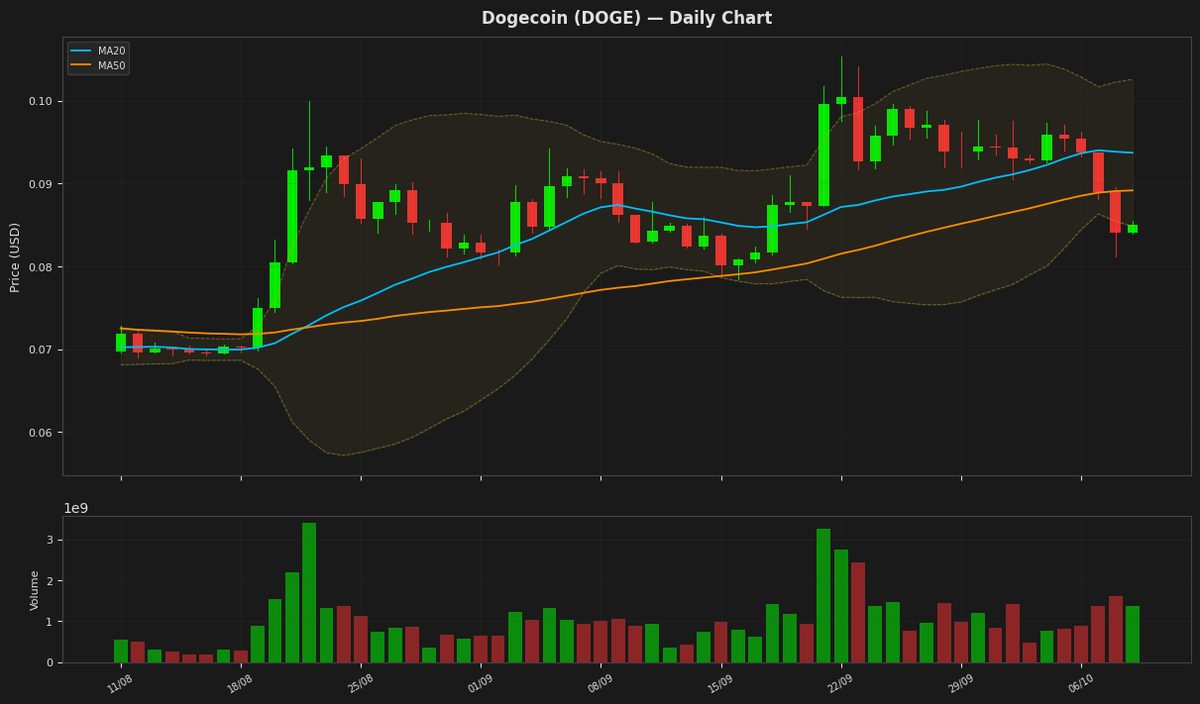
Dogecoin is currently trading at $0.085060, remaining below both the MA20 and MA50, which indicates a prevailing bearish trend. The RSI of 20.84 suggests the asset is in oversold territory, while the price is currently testing the lower Bollinger Band. Despite a slight daily gain of 1.22%, the MACD remains below the signal line, suggesting limited bullish momentum.
Disclaimer
The content on MarketsFN.com is provided for educational and informational purposes only. It does not constitute financial advice or investment recommendations. All investments involve risk. Past performance does not guarantee future results.