Crypto Market Sees Gains: Dogecoin, Solana, and Ripple Lead the Charge
QuoteReporter
•5 min read
Crypto Market Sees Gains: Dogecoin, Solana, and Ripple Lead the Charge
Crypto Market Report | October 02, 2026
📊 Crypto Market Overview
The cryptocurrency market is currently exhibiting a positive sentiment, with most major assets trading in the green. Bitcoin is leading the way, having risen by 1.80% to $86,380.5781, with its Relative Strength Index (RSI) standing at 71.3, indicating a potentially overbought condition. The Moving Average Convergence Divergence (MACD) indicator is at 2141.4520, further suggesting a strong upward momentum. Other top cryptocurrencies, such as Ethereum, Ripple, and Solana, are also showing gains, with increases of 2.04%, 2.78%, and 3.28%, respectively.
The positive market sentiment is likely driven by the recent inflow into Bitcoin ETFs, which saw $103 million in investments, kickstarting what is colloquially known as 'Uptober'. This influx of capital into traditional investment vehicles tied to cryptocurrencies can be seen as a sign of growing institutional confidence. Meanwhile, regulatory developments continue to shape the landscape, with the SEC taking steps to clear hurdles for advisers offering cryptocurrency custody services.
From a technical standpoint, several major cryptocurrencies are showing signs of strong upward momentum, with Ethereum's RSI at 70.0 and MACD at 77.5924, indicating a potentially overbought condition similar to Bitcoin. Solana and Ripple are also displaying bullish signals, with their RSI values below 70 but with positive MACD indicators. In contrast, Tron is the outlier among the major assets, with a decline of 0.08% and an RSI of 42.9, suggesting it is relatively oversold. Overall, the market is characterized by a mix of strong performers and laggards, with the broader trend currently favoring the bulls. The recent security warnings and exploits highlight the ongoing risks in the space, underscoring the need for continued vigilance among investors.
The positive market sentiment is likely driven by the recent inflow into Bitcoin ETFs, which saw $103 million in investments, kickstarting what is colloquially known as 'Uptober'. This influx of capital into traditional investment vehicles tied to cryptocurrencies can be seen as a sign of growing institutional confidence. Meanwhile, regulatory developments continue to shape the landscape, with the SEC taking steps to clear hurdles for advisers offering cryptocurrency custody services.
From a technical standpoint, several major cryptocurrencies are showing signs of strong upward momentum, with Ethereum's RSI at 70.0 and MACD at 77.5924, indicating a potentially overbought condition similar to Bitcoin. Solana and Ripple are also displaying bullish signals, with their RSI values below 70 but with positive MACD indicators. In contrast, Tron is the outlier among the major assets, with a decline of 0.08% and an RSI of 42.9, suggesting it is relatively oversold. Overall, the market is characterized by a mix of strong performers and laggards, with the broader trend currently favoring the bulls. The recent security warnings and exploits highlight the ongoing risks in the space, underscoring the need for continued vigilance among investors.
📰 Crypto News
- Bitcoin ETFs kick off ‘Uptober’ with $103M inflow
- Here’s what happened in crypto today
- South Korea crypto exchange profits fall 78% in H1 amid trading slump
- South Korea advances tokenized securities rules ahead of 2027 rollout
- Zano exploiter minted more than a quadrillion fUSD before blockchain rollback
- Core Lightning warns attackers are targeting unpatched nodes
- Ethereum’s zkAPI brings privacy-preserving API payments to mainnet
- NEAR Intents says it’s identified the hacker, gives 48-hour ultimatum
- SEC moves to clear custody hurdle for advisers offering crypto
- China warns foreign spies about crypto, Singapore dominates Asia: Asia Express
- Evernorth clears shareholder vote ahead of Nasdaq debut with 473M XRP treasury
- Trump to host 3rd ‘exclusive’ memecoin event amid corruption claims
- Tether's USDT is 'coming home' to Bitcoin this month over a decade after debut there
- Bitcoin tops $86,000 ahead of U.S. jobs report
- Zcash Drops 21% From Recent High—Here’s Why the Rally May Not Be Over
🔍 Technical Analysis
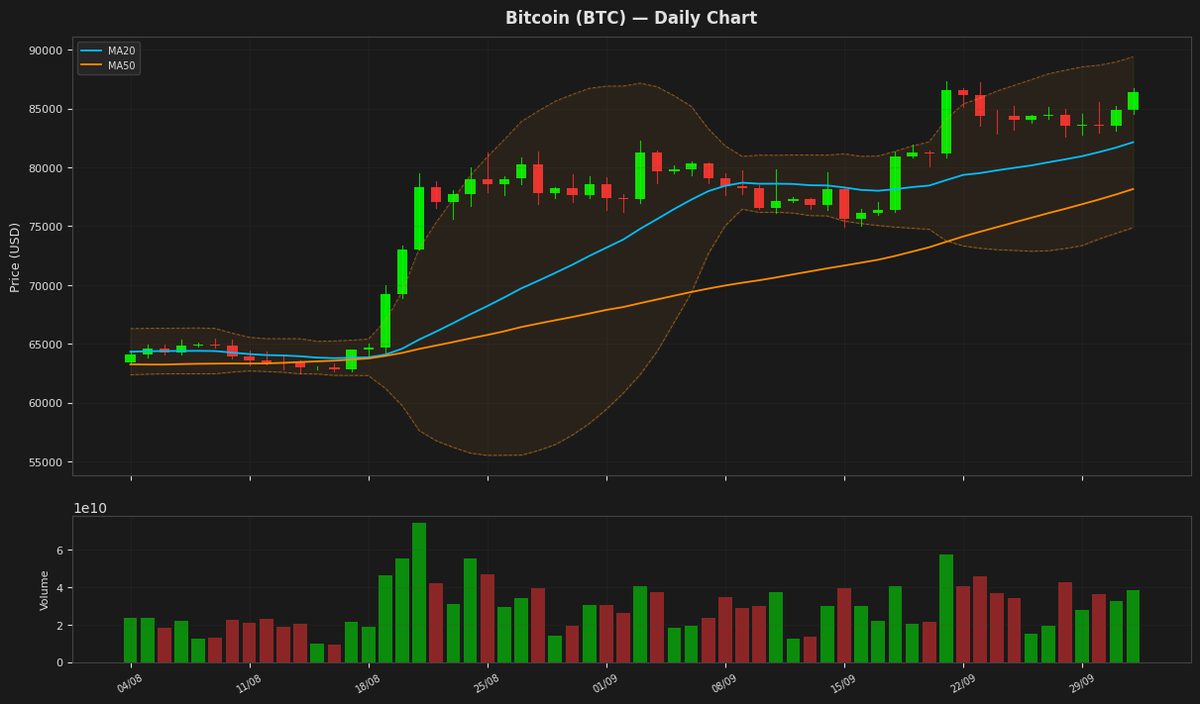
Bitcoin (BTC) — +1.80%
$86,380.58 52W: $57,747.77 — $90,439.29
Bitcoin's price is currently at $86,380, showing a daily increase of 1.80% and trading near the upper Bollinger Band at $89,400, indicating a potentially overbought condition as also suggested by the RSI(14) value of 71.327237. The MACD is slightly below its signal line, hinting at a possible slowdown in the upward momentum. The ATR(14) of $2,222 indicates high volatility.
Ethereum (ETH) — +2.04%
$2,760.80 52W: $1,506.51 — $3,040.72
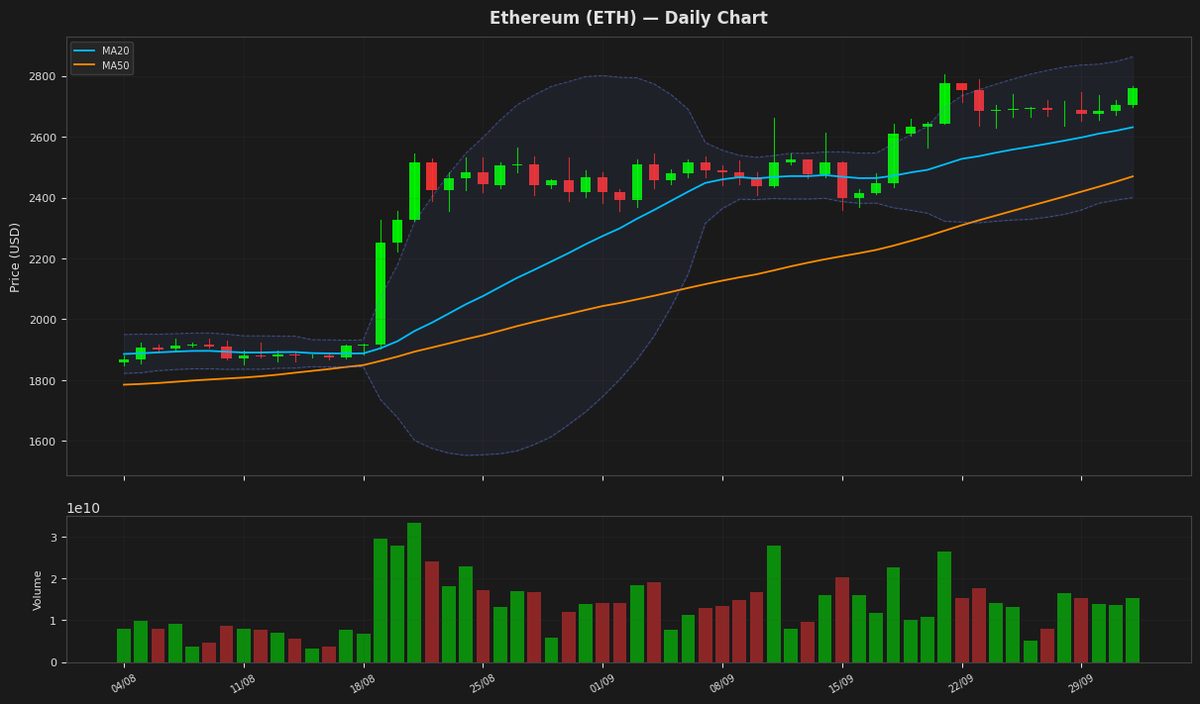
Ethereum's price is currently at $2,760.80, showing a daily increase of 2.04% and trading near the upper Bollinger Band at $2,863.16, indicating a potentially overbought condition as also suggested by the RSI(14) value of 70.01. The MACD is below its signal line, hinting at a possible slowdown in the upward momentum. The ATR(14) of 79.99 indicates moderate volatility.
Ripple (XRP) — +2.78%
$1.5355 52W: $0.988422 — $1.9382
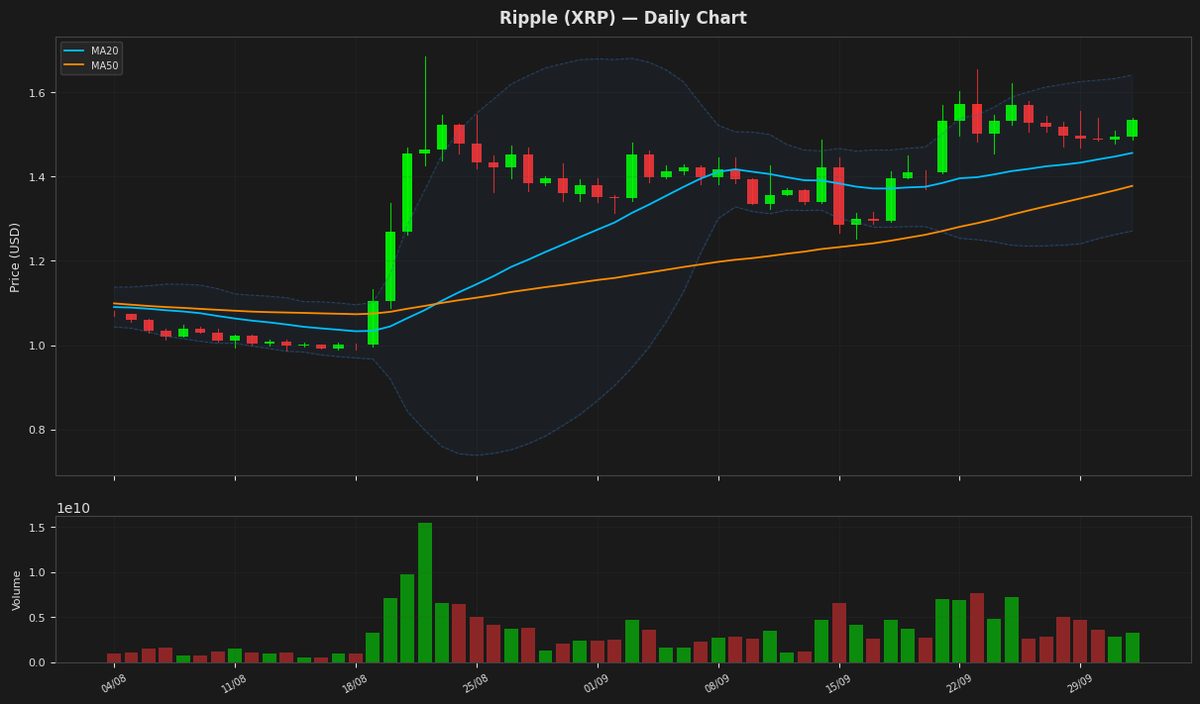
Ripple's price is trading above its 20-day and 50-day moving averages, indicating a bullish trend. The Relative Strength Index is at 65.73, nearing overbought territory, while the MACD is below its signal line, suggesting a potential slowdown in the upward momentum. The price is also approaching the upper Bollinger Band at $1.64, which may act as a resistance level. The Average True Range indicates moderate volatility.
Solana (SOL) — +3.28%
$122.2800 52W: $60.4147 — $127.9663
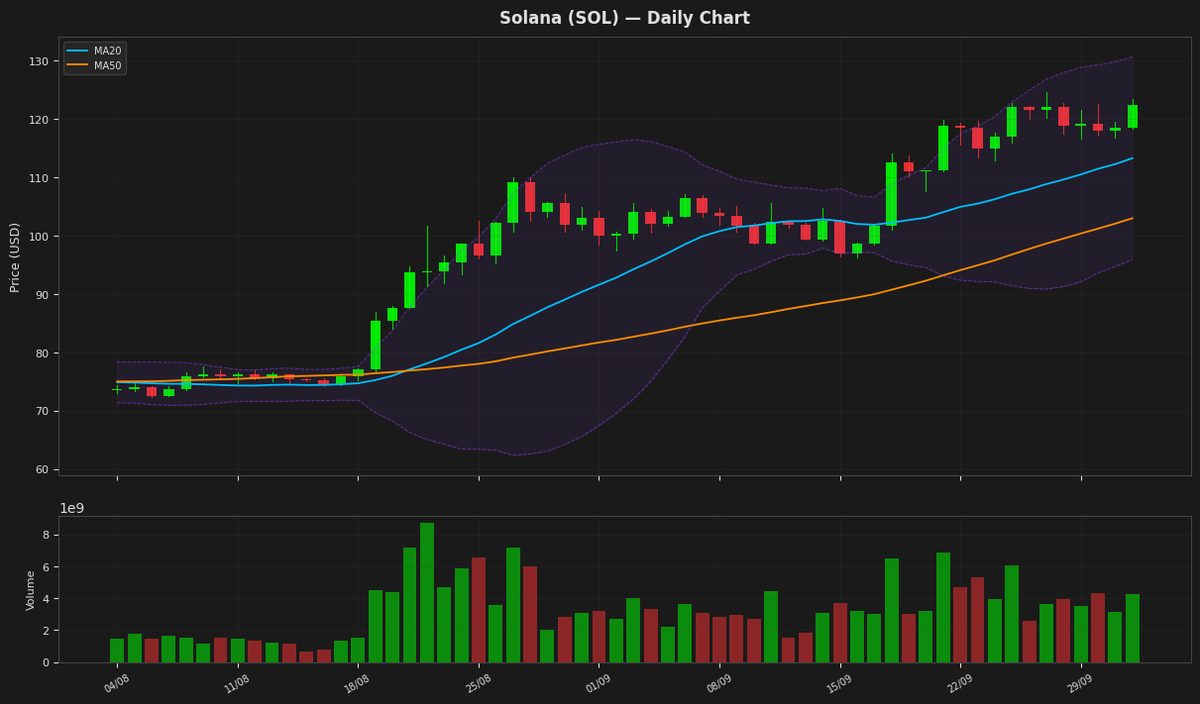
Solana's price is currently at $122.28, showing a daily gain of 3.28% and trading near its 52-week high of $127.97. The RSI at 66.06 indicates a moderately overbought condition, while the MACD is slightly below its signal line, suggesting a potential slowdown in the upward momentum. The price is also near the upper Bollinger Band at $130.60, indicating a potential resistance level. The ATR suggests moderate volatility.
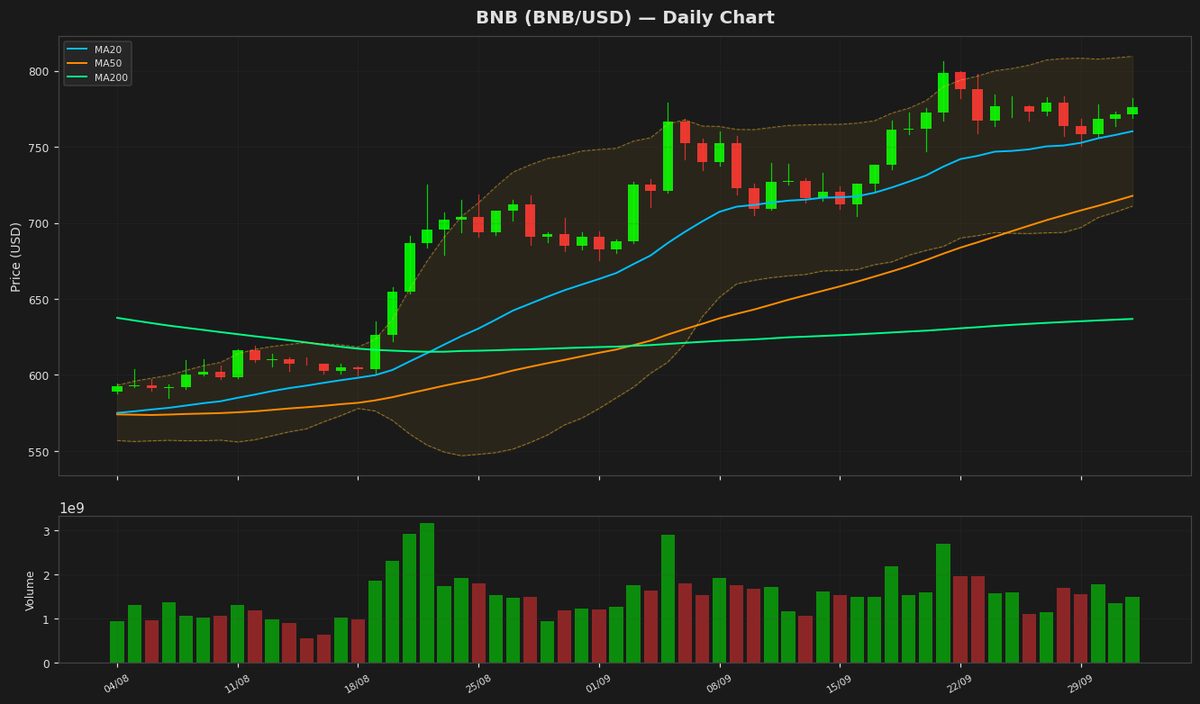
BNB (BNB) — +1.03%
$779.1400 52W: $538.5992 — $907.3658
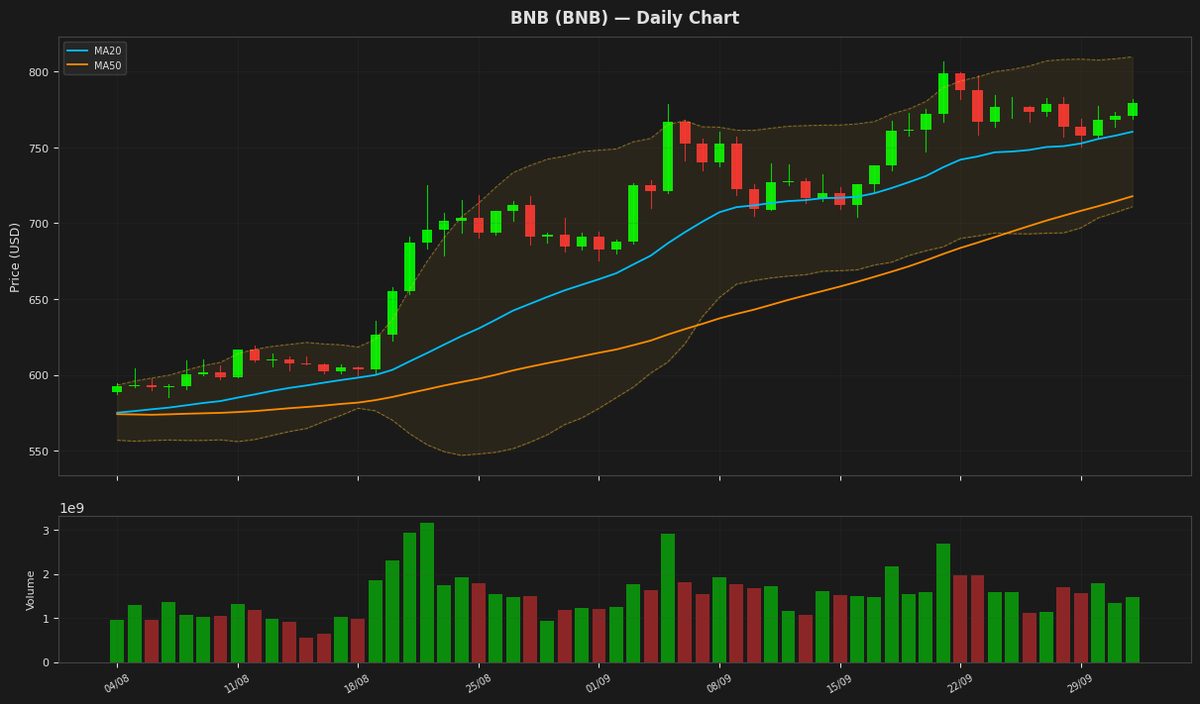
BNB is trading at $779.14, showing a 1.03% daily gain, and is positioned above its MA20 and MA50, indicating a bullish trend. The RSI is at 56.96, suggesting moderate buying pressure, while the MACD is below its signal line, indicating a potential slowdown in the upward momentum. The price is also near the upper Bollinger Band at $809.86, indicating potential resistance.
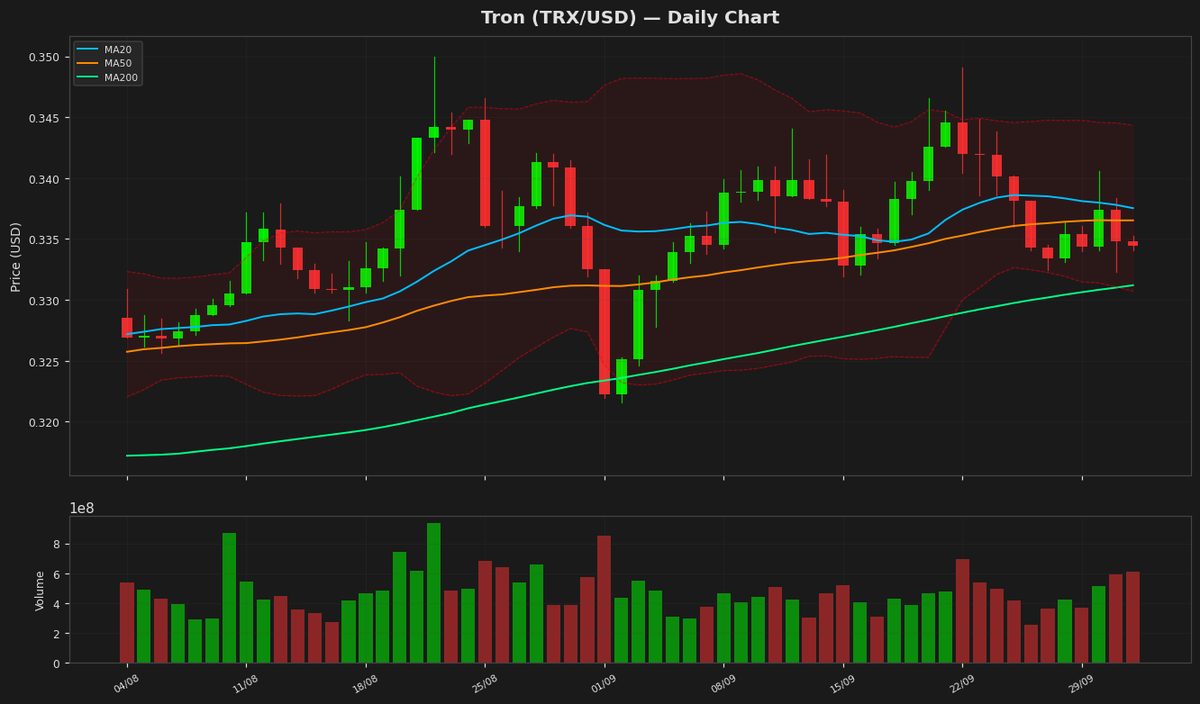
Tron (TRX) — -0.08%
$0.334550 52W: $0.268138 — $0.376332
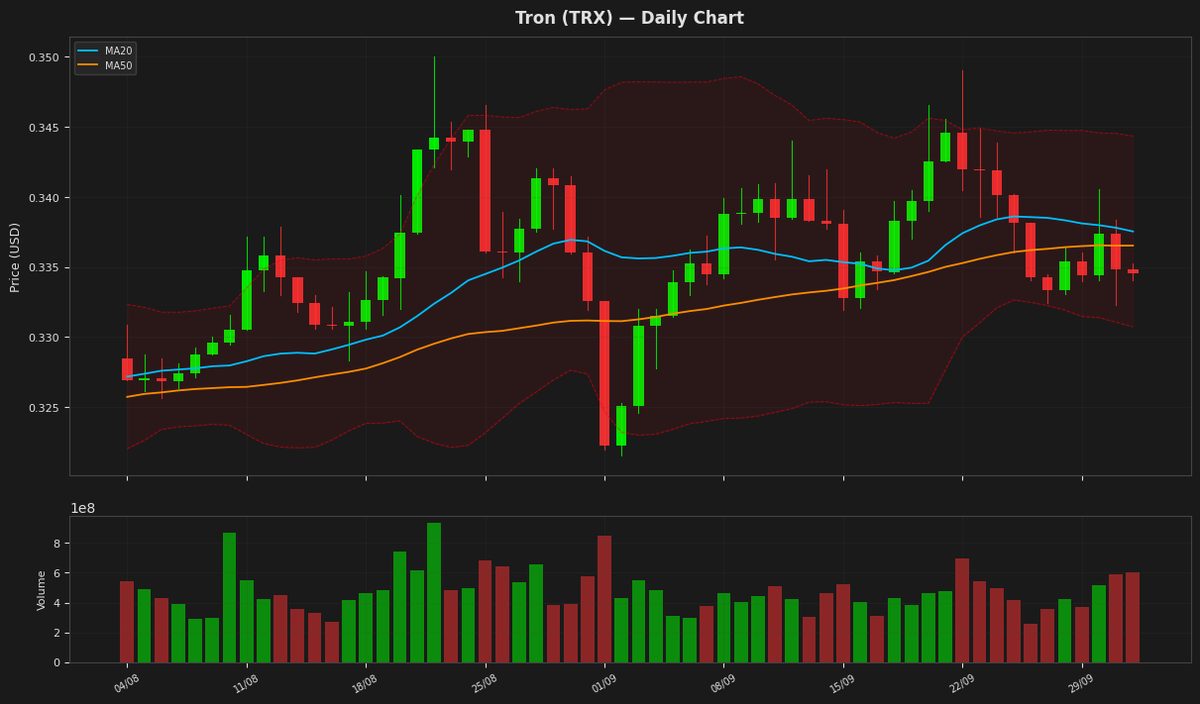
Tron's price is currently at $0.334550, showing a minor decline, and is positioned near the lower end of the Bollinger Bands, with the lower band at $0.330728. The RSI is at 42.927574, indicating a neutral to slightly oversold condition. The MACD is below the signal line, suggesting a bearish signal. The ATR indicates moderate volatility.
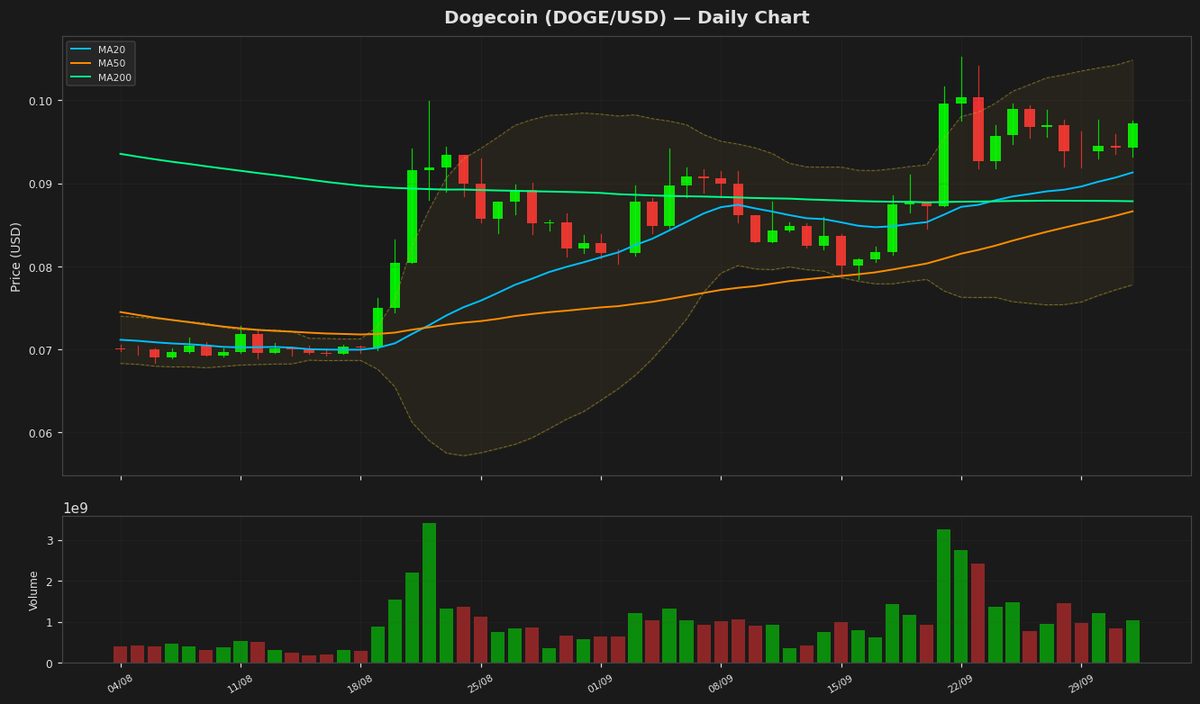
Dogecoin (DOGE) — +3.29%
$0.097430 52W: $0.067973 — $0.127272
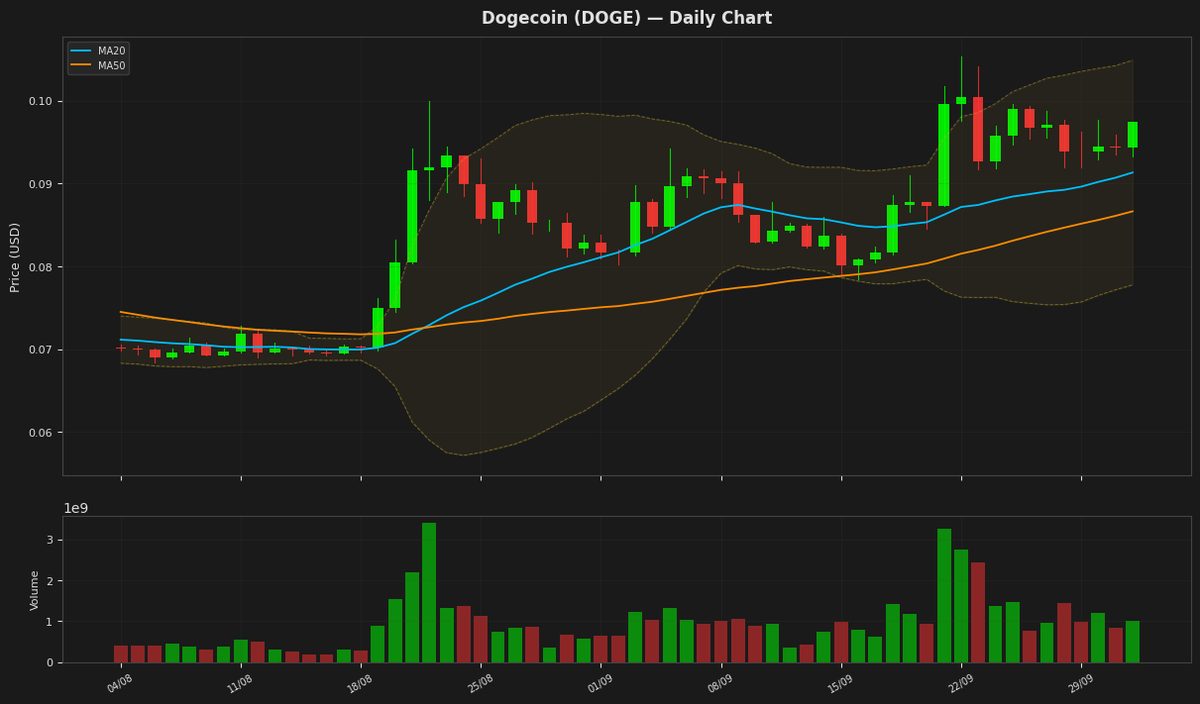
Dogecoin's price is currently trading above its 20-day and 50-day moving averages, indicating a positive trend. The RSI is at 63.45, suggesting the cryptocurrency is not overbought yet. The MACD is slightly below its signal line, indicating a potential slowdown in the upward momentum. The price is also near the upper Bollinger Band at $0.104868, which may act as a resistance level.
Disclaimer
The content on MarketsFN.com is provided for educational and informational purposes only. It does not constitute financial advice or investment recommendations. All investments involve risk. Past performance does not guarantee future results.