Crypto Market Sees Gains: Dogecoin, Solana, and Ethereum Lead the Charge
QuoteReporter
•5 min read
Crypto Market Report | October 28, 2026
📊 Crypto Market Overview
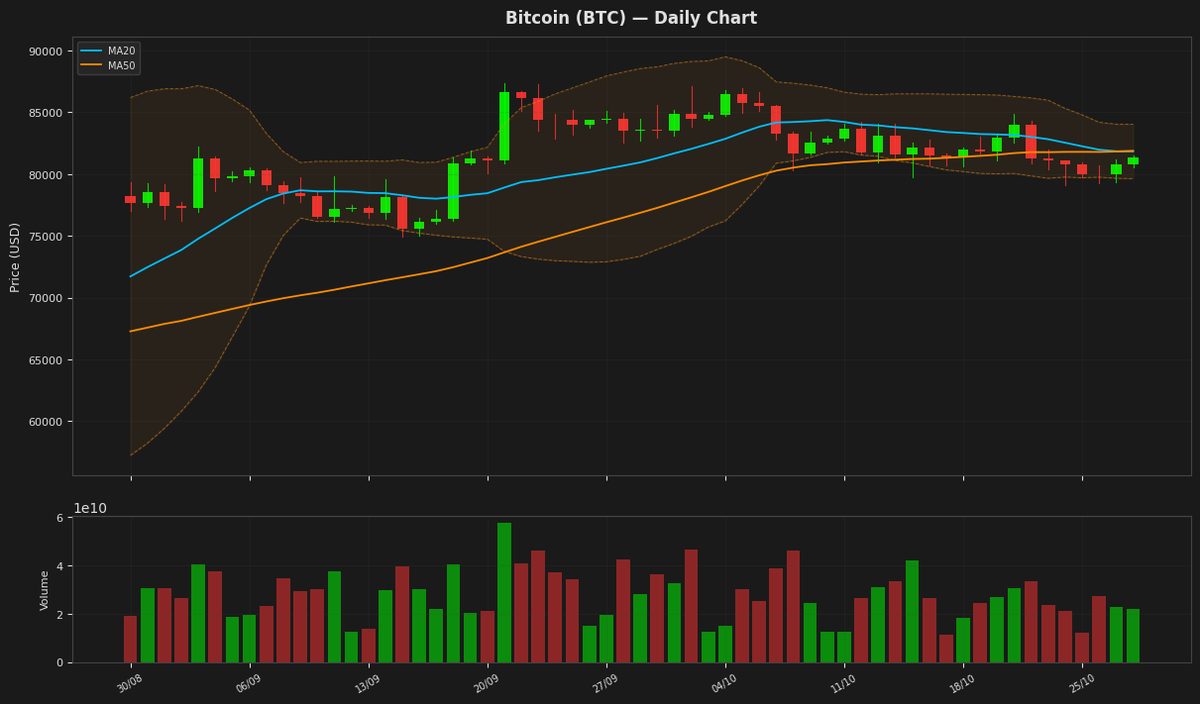
The cryptocurrency market is currently displaying a cautiously optimistic sentiment, with most major assets trading in the green. Bitcoin, the largest cryptocurrency by market capitalization, has rebounded above $80,000, with its price currently standing at $81,364.4062, representing a 0.69% gain over the past 24 hours. The Relative Strength Index (RSI) for Bitcoin is at 49.0, indicating a neutral stance, while the Moving Average Convergence Divergence (MACD) is at -422.3581, suggesting a bearish trend.
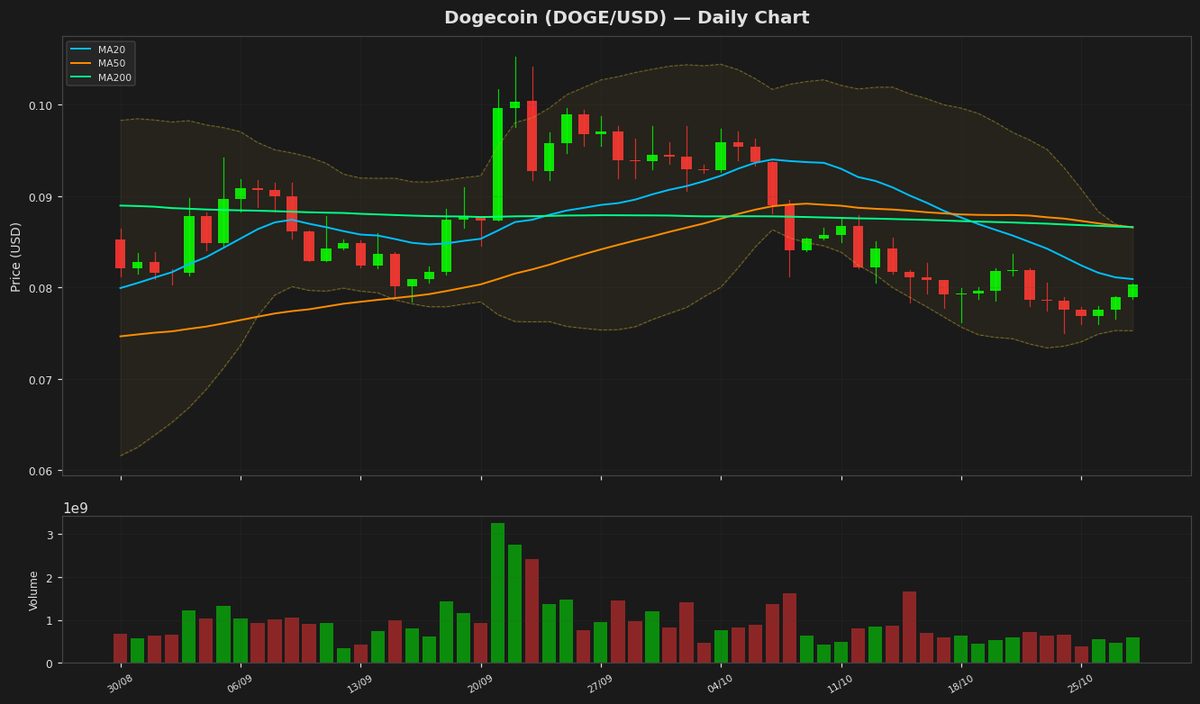
Other key cryptocurrencies are also showing mixed signals. Ethereum is trading at $2,366.0701, up 0.78% today, with an RSI of 42.3 and a MACD of -56.0884, indicating a potential bearish trend. Solana has outperformed other major assets, with a 1.31% gain, taking its price to $102.5800. Dogecoin has also seen a notable increase of 1.48%, reaching $0.0801.
The recent surge in Bitcoin's price has been accompanied by significant inflows into Bitcoin ETFs, which have climbed to $176 million. This development is likely linked to the broader market rebound. In a related macroeconomic context, it is worth noting that Bitcoin has historically performed well following midterm elections, with an average gain of 50%.
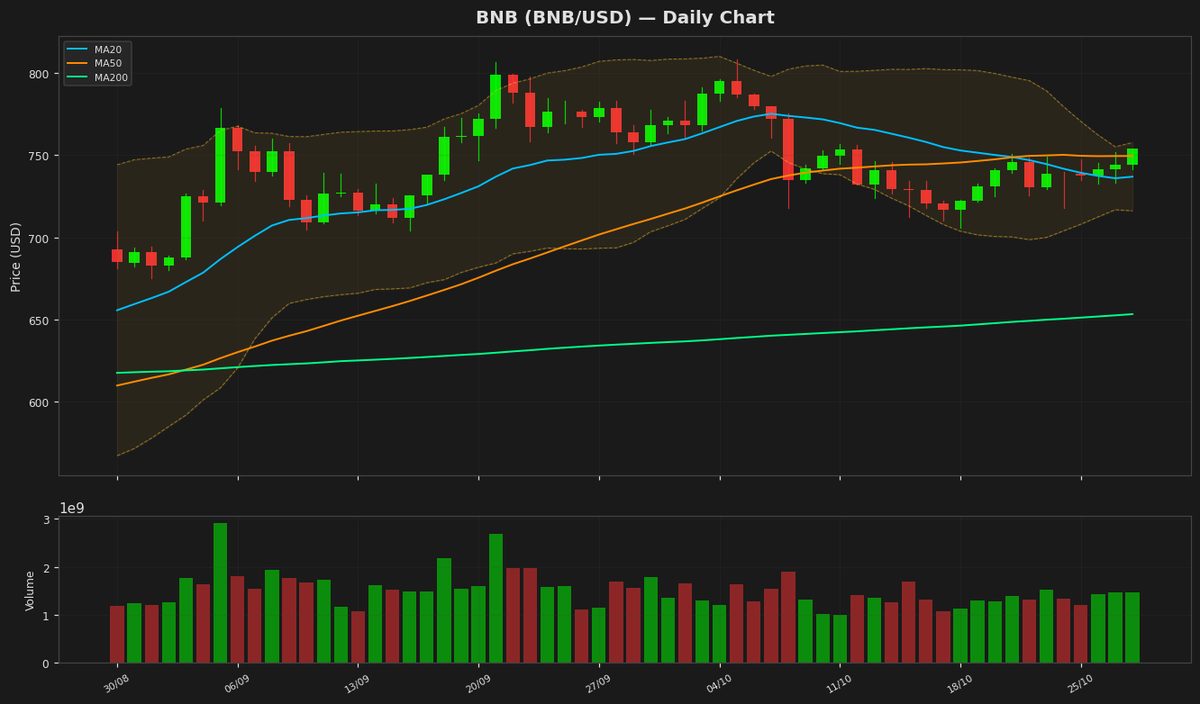
Notable technical signals include BNB's RSI of 62.9, indicating a potentially overbought condition. Meanwhile, several cryptocurrencies, including Ethereum and Solana, are displaying bearish MACD indicators, suggesting a potential downward trend. The market is also being influenced by news of a data leak at Bithumb, a South Korean cryptocurrency exchange, and concerns over tokenization uncertainty in the US, as expressed by Robinhood's CEO. Overall, the cryptocurrency market is currently characterized by a mix of positive and negative factors, with investors closely monitoring market trends and news.
📰 Crypto News
- Bitcoin ETF inflows climb to $176M as BTC rebounds above $80K
- Coinbase denies systems breach, says vendor exposed customer data
- Here’s what happened in crypto today
- Robinhood’s Tenev warns US tokenization uncertainty deters ‘serious assets’
- Bithumb discloses data leak after internal system breach: Report
- Discord is making public chats searchable on Google: How to opt out
- Bitcoin has soared 50% on average after midterms. The S&P 500 has gained 15%.
- Securitize adds Stellar blockchain as institutional tokenization gathers steam
- Bitcoin treasury Datavault AI plunges 50% after firm says it can’t access its BTC
- Bithumb hacked through employee system as South Korean financial firms face cyberattacks
- Bitcoin nears $81,000 ahead of Fed decision as ZEC jumps 8%
- Coinbase says user funds are safe after third-party vendor exposes customer contact info
🔍 Technical Analysis
Bitcoin (BTC) — +0.69%
$81,364.41 52W: $57,747.77 — $87,363.76
Bitcoin is currently trading at $81,364.406250 with a slight increase of 0.69% in a day, near its 20-day and 50-day moving averages, indicating a neutral short-term trend. The RSI is at 48.974635, suggesting a balanced market without a clear direction. The MACD is below its signal line, indicating a potential bearish signal, while the price remains within the Bollinger Bands.
Ethereum (ETH) — +0.78%
$2,366.07 52W: $1,506.51 — $2,805.50
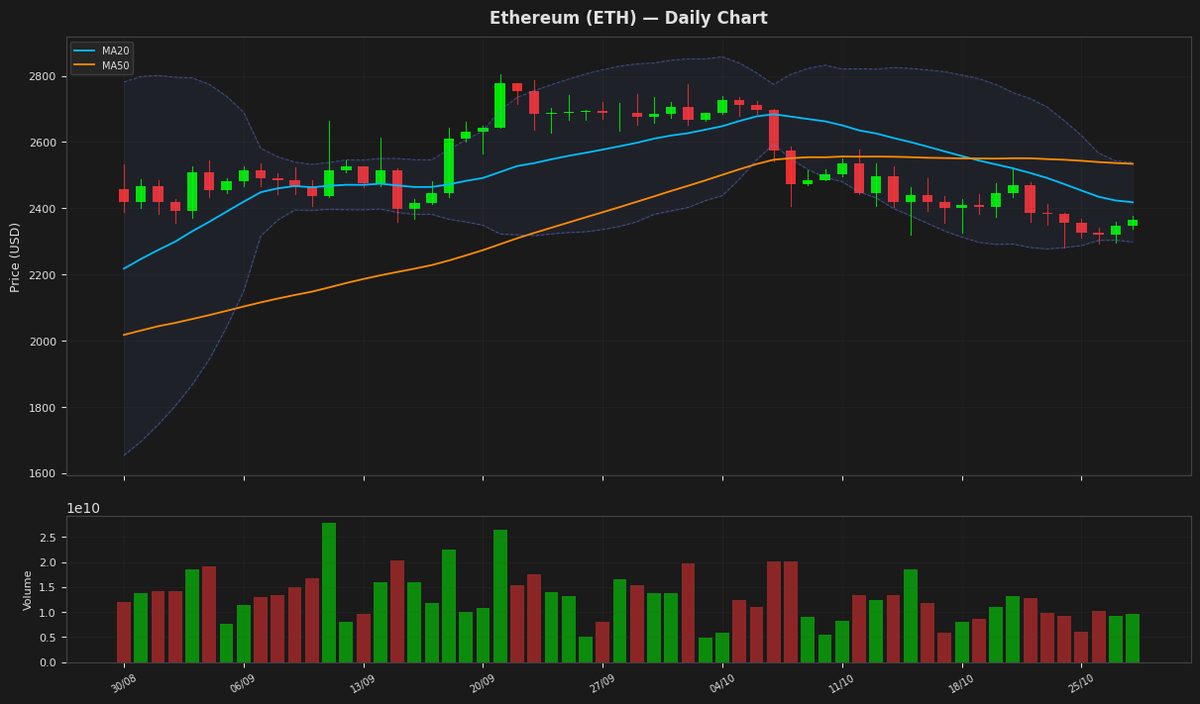
Ethereum's price is currently at $2,366, showing a slight increase of 0.78% and is positioned below both its MA20 at $2,418 and MA50 at $2,534, indicating a bearish trend. The RSI at 42.29 suggests that the asset is nearing oversold territory, while the MACD is below its signal line, reinforcing the bearish sentiment. The price is also within the Bollinger Bands, with the upper and lower bands at $2,538 and $2,298 respectively.
Ripple (XRP) — -0.03%
$1.3292 52W: $0.988422 — $1.6838
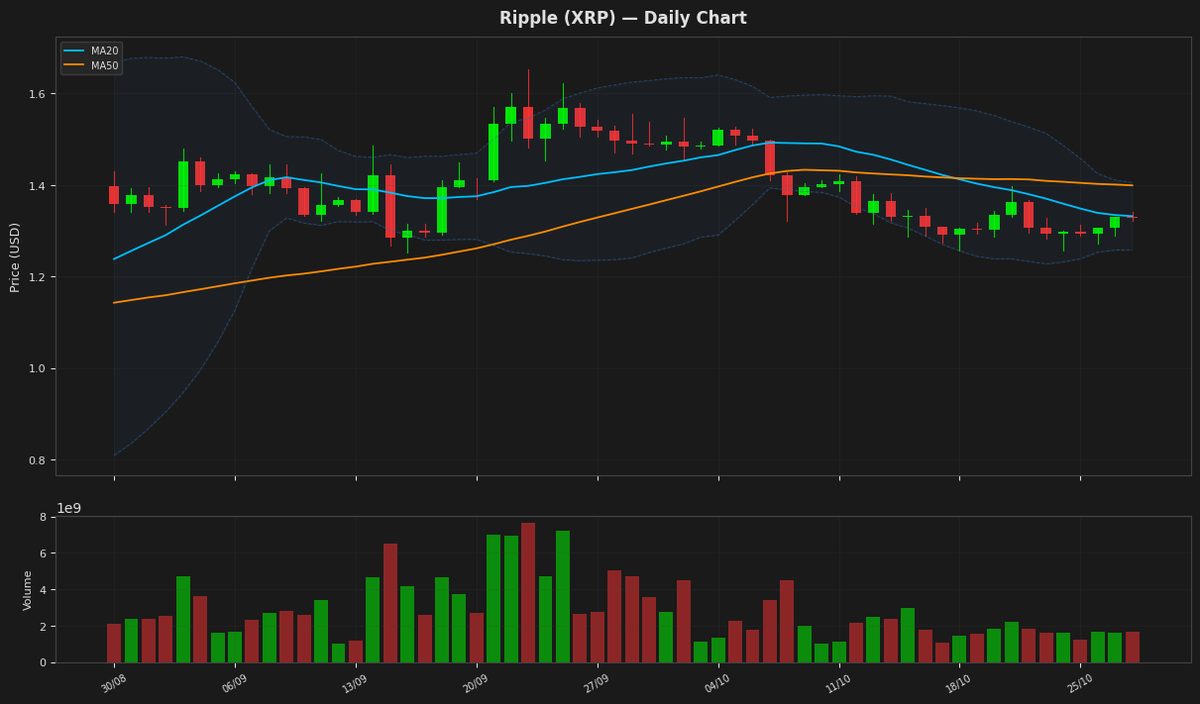
Ripple's price is currently at $1.329200, showing a minor decline, and is hovering near the middle of the Bollinger Bands, indicating a lack of strong directional momentum. The RSI is at 49.871023, suggesting a neutral stance, while the MACD is slightly above its signal line, hinting at a potential stabilization. The price is below both MA20 and MA50, indicating a bearish trend in the short to medium term. The ATR indicates moderate volatility.
Solana (SOL) — +1.31%
$102.5800 52W: $60.4147 — $124.6174
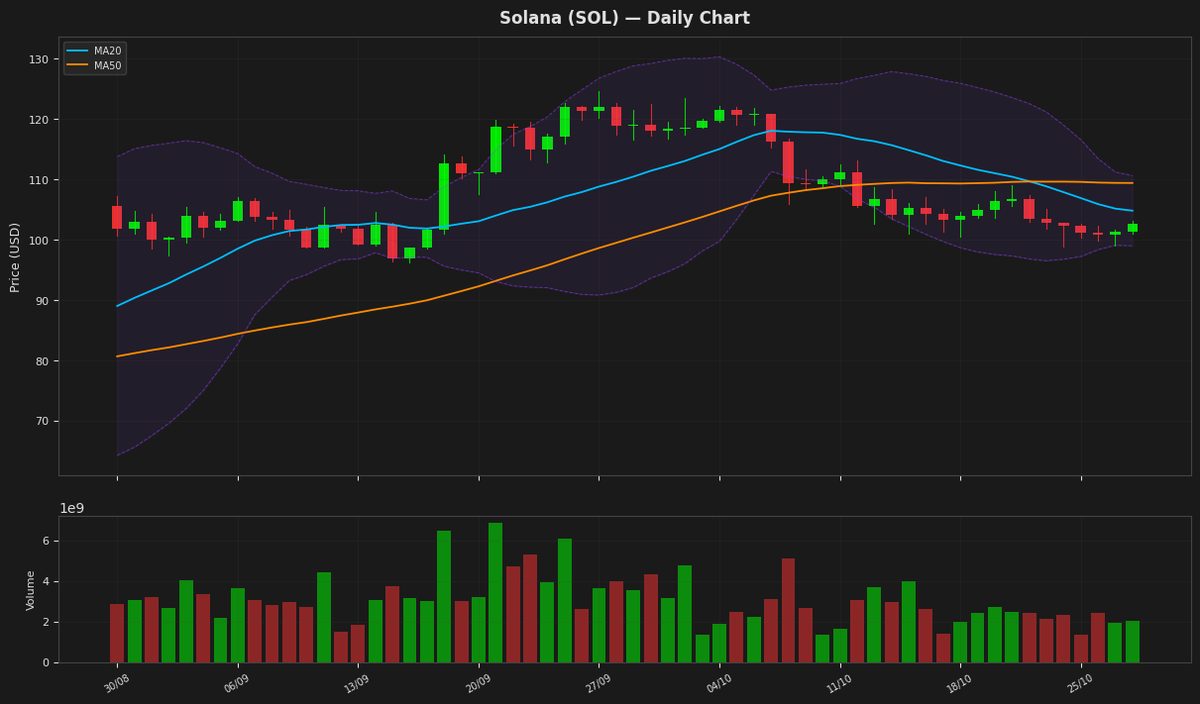
Solana's price is currently at $102.58, showing a slight increase of 1.31% for the day. The RSI reading of 44.89 suggests that the asset is nearing oversold territory, while the MACD is below its signal line, indicating a bearish trend. The price is also below both the MA20 and MA50, and is closer to the lower Bollinger Band, indicating potential support around $98.99. The ATR indicates moderate volatility.
BNB (BNB) — +0.69%
$749.3000 52W: $538.5992 — $808.4329
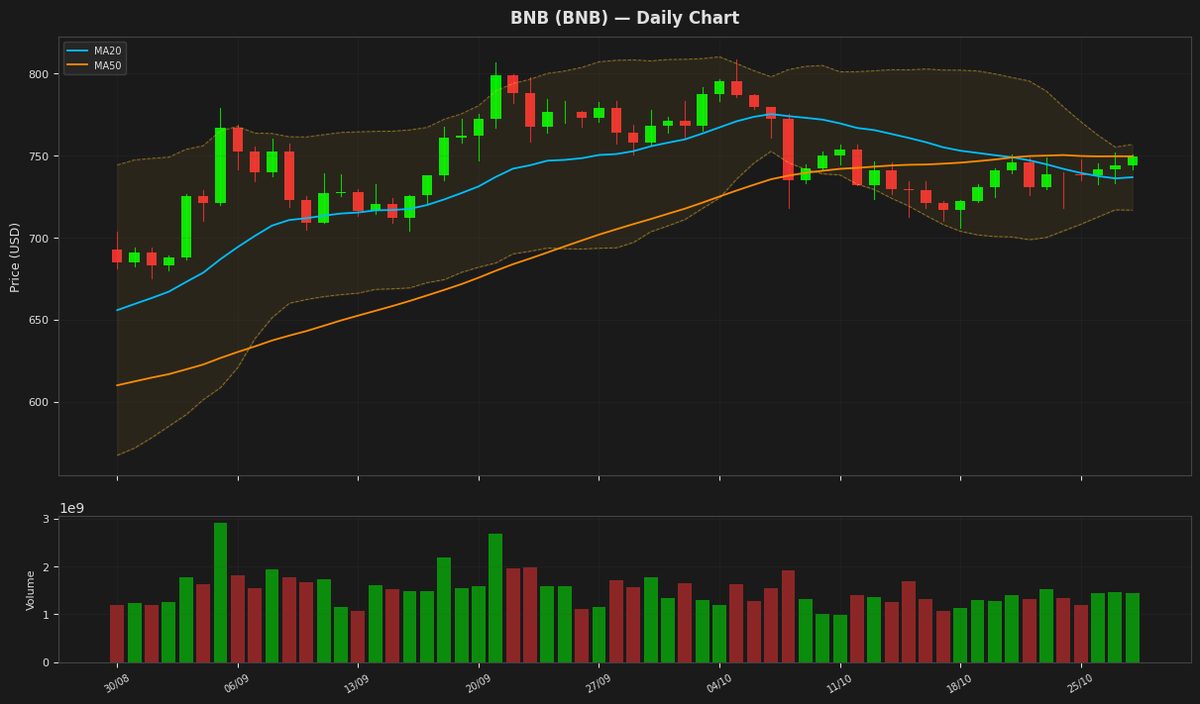
BNB is currently trading at $749.30 with a slight increase of 0.69% in a day, near its 50-day moving average of $749.49. The Relative Strength Index (RSI) at 62.93 indicates a moderate bullish momentum, while the MACD line is above its signal line, suggesting a potential buy signal. The price is also near the upper Bollinger Band at $756.78, indicating a possible resistance level.
Tron (TRX) — +0.10%
$0.331435 52W: $0.278389 — $0.376332
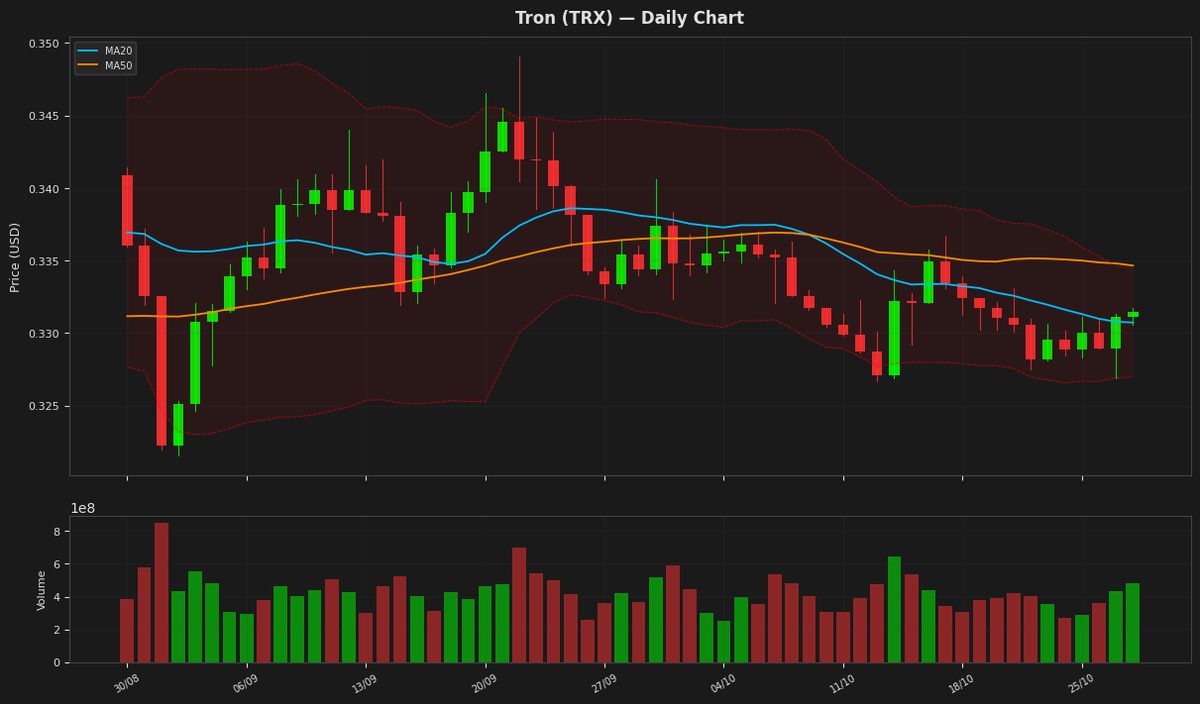
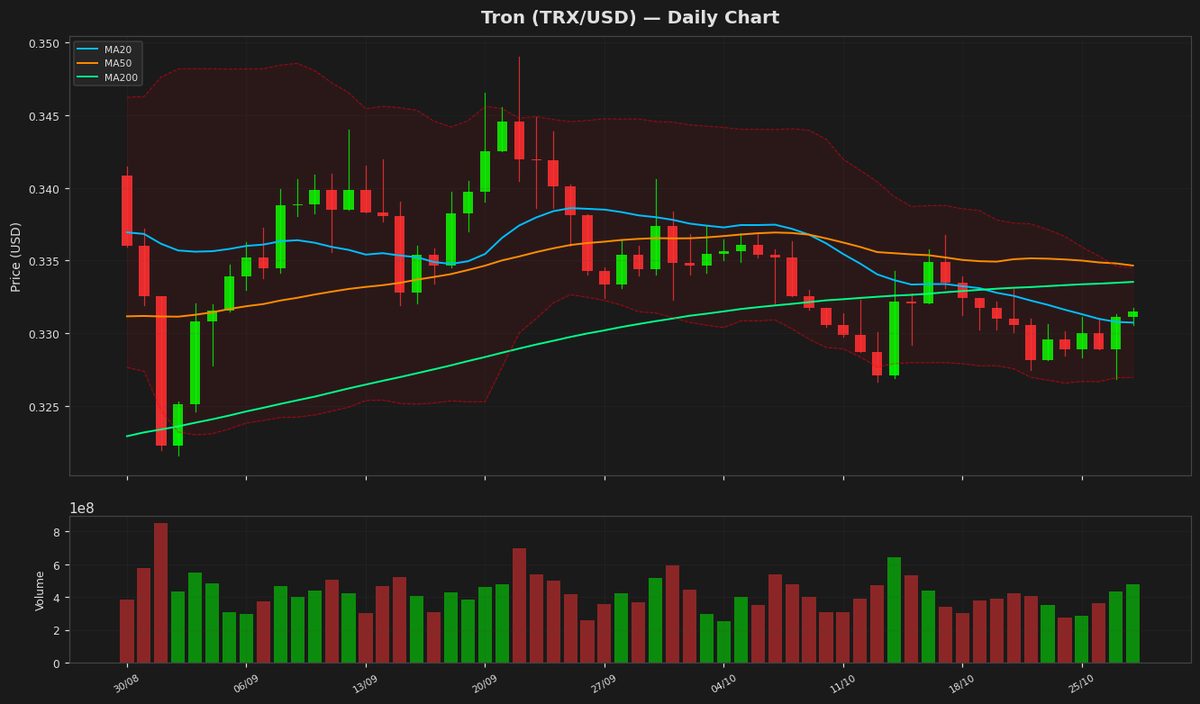
Tron's price is currently at $0.331435, showing a marginal increase of 0.10%. The RSI value of 47.669772 indicates a neutral market sentiment, while the MACD line is below the signal line, suggesting a bearish trend. The price is hovering near the middle of the Bollinger Bands, with the upper and lower bands at 0.334494 and 0.326958 respectively, indicating moderate volatility.
Dogecoin (DOGE) — +1.48%
$0.080150 52W: $0.067973 — $0.118255
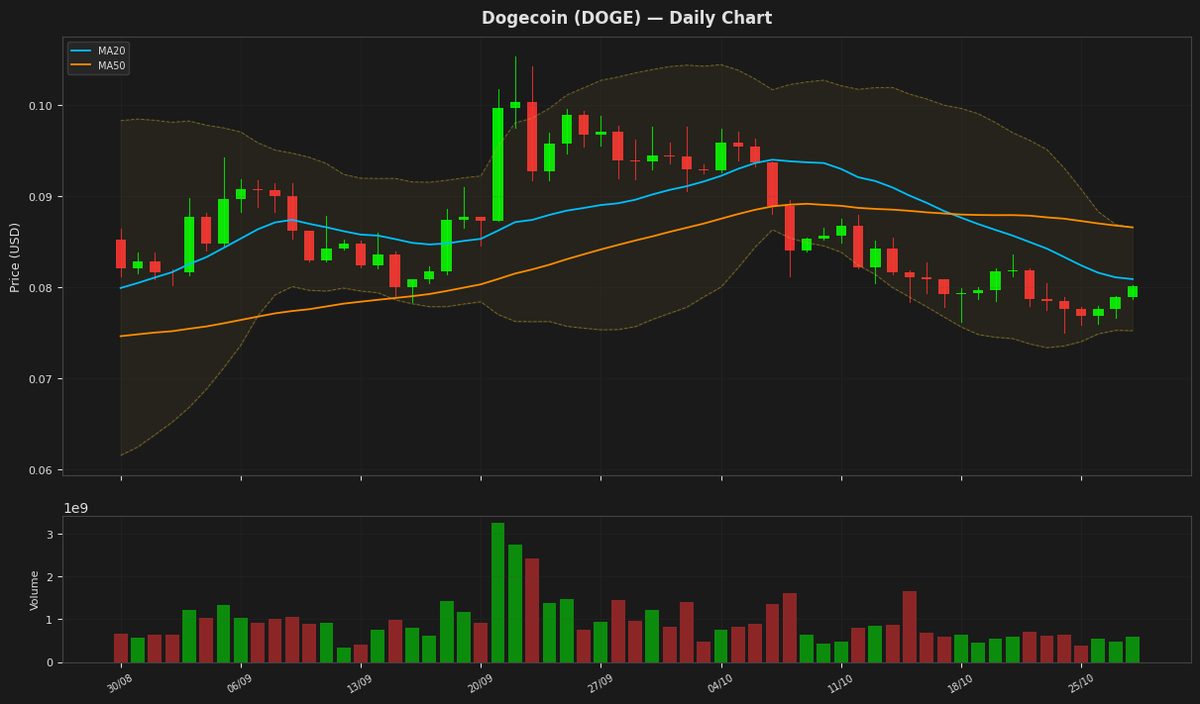
Dogecoin's price is currently at $0.080150, showing a slight increase of 1.48% in a day, as it trades near the middle of the Bollinger Bands. The RSI is at 44.252534, indicating a neutral territory, while the MACD is below its signal line, suggesting a bearish trend. The price is below both MA20 and MA50, indicating a downtrend. The ATR suggests moderate volatility.
Disclaimer
The content on MarketsFN.com is provided for educational and informational purposes only. It does not constitute financial advice or investment recommendations. All investments involve risk. Past performance does not guarantee future results.