Crypto Market Cools as Dogecoin, Solana and Ripple Dip
QuoteReporter
•5 min read
Crypto Market Cools as Dogecoin, Solana and Ripple Dip
Crypto Market Report | October 08, 2026
📊 Crypto Market Overview
The cryptocurrency market is currently experiencing a period of cautious consolidation, characterized by a broad decline across major assets. Market sentiment is weighed down by significant capital outflows, most notably from US Bitcoin ETFs, which saw a daily exit of 485 million dollars, the largest since June. This institutional retreat coincides with a complex macro environment where political tensions in the US and new tax proposals in Greece are creating headwinds for investor confidence.
Bitcoin is trading at 82,961.34 dollars, showing a slight decrease of 0.38 percent. Its technical profile remains relatively stable with an RSI of 42.2 and a positive MACD of 1450.20. In contrast, Ethereum and Ripple are showing signs of deeper bearish momentum. Ethereum is priced at 2,564.09 dollars with an RSI of 30.6, while Ripple, trading at 1.41 dollars, has entered oversold territory with an RSI of 27.7. Solana and BNB have also retreated, dropping 1.06 percent and 0.54 percent respectively, though both maintain RSI levels in the mid-40s. Dogecoin has seen the sharpest daily decline among the top assets at 1.31 percent.
Despite the general downturn, ecosystem expansion continues. Samsung Wallet is integrating USDC transfers for US users, and Circle is expanding its payment reach through SAP. NEAR has emerged as a key mover, entering the top twenty assets following a 140 percent surge over the last thirty days. Institutional infrastructure is also evolving, as evidenced by Standard Chartered's plans for crypto custody in Singapore. These developments suggest a divergence between short-term price action and long-term adoption trends. While technical signals for the largest coins point toward a cooling period, the integration of stablecoins into mainstream corporate software and hardware remains a primary driver of fundamental utility within the broader digital asset landscape.
Bitcoin is trading at 82,961.34 dollars, showing a slight decrease of 0.38 percent. Its technical profile remains relatively stable with an RSI of 42.2 and a positive MACD of 1450.20. In contrast, Ethereum and Ripple are showing signs of deeper bearish momentum. Ethereum is priced at 2,564.09 dollars with an RSI of 30.6, while Ripple, trading at 1.41 dollars, has entered oversold territory with an RSI of 27.7. Solana and BNB have also retreated, dropping 1.06 percent and 0.54 percent respectively, though both maintain RSI levels in the mid-40s. Dogecoin has seen the sharpest daily decline among the top assets at 1.31 percent.
Despite the general downturn, ecosystem expansion continues. Samsung Wallet is integrating USDC transfers for US users, and Circle is expanding its payment reach through SAP. NEAR has emerged as a key mover, entering the top twenty assets following a 140 percent surge over the last thirty days. Institutional infrastructure is also evolving, as evidenced by Standard Chartered's plans for crypto custody in Singapore. These developments suggest a divergence between short-term price action and long-term adoption trends. While technical signals for the largest coins point toward a cooling period, the integration of stablecoins into mainstream corporate software and hardware remains a primary driver of fundamental utility within the broader digital asset landscape.
📰 Crypto News
- Samsung Wallet to add USDC transfers for US Galaxy users in October
- NEAR enters crypto’s top 20 after 140% surge in 30 days
- Standard Chartered plans institutional crypto custody in Singapore
- Greece plans 10% capital gains tax on cryptocurrencies
- US Bitcoin ETFs shed $485M in biggest daily outflow since June
- Here’s what happened in crypto today
- Crypto’s heavy backing of Republicans alienated Democrats: Cuomo
- Crypto must cement adoption to withstand US policy shifts: Canton CEO
- Vitalik Buterin backs crypto ‘bunker mode’ amid rapid AI math advances
- Circle brings USDC, EURC payments to SAP customers through Tereina
- Crypto investment firm Deus X Capital shuts down as backers pursue separate strategies
- Ripple is earning fees financing leveraged stock bets, a business long run by banks
- Bitcoin loans are paying for tuition and working capital, not just trades, lenders say
- Ethereum’s Glamsterdam test runs near 200 million gas per block after upgrade
- Bitcoin breaks below $83,000 as oil jumps on Iran strike-plan report
🔍 Technical Analysis
Bitcoin (BTC) — -0.38%
$82,961.34 52W: $57,747.77 — $87,363.76
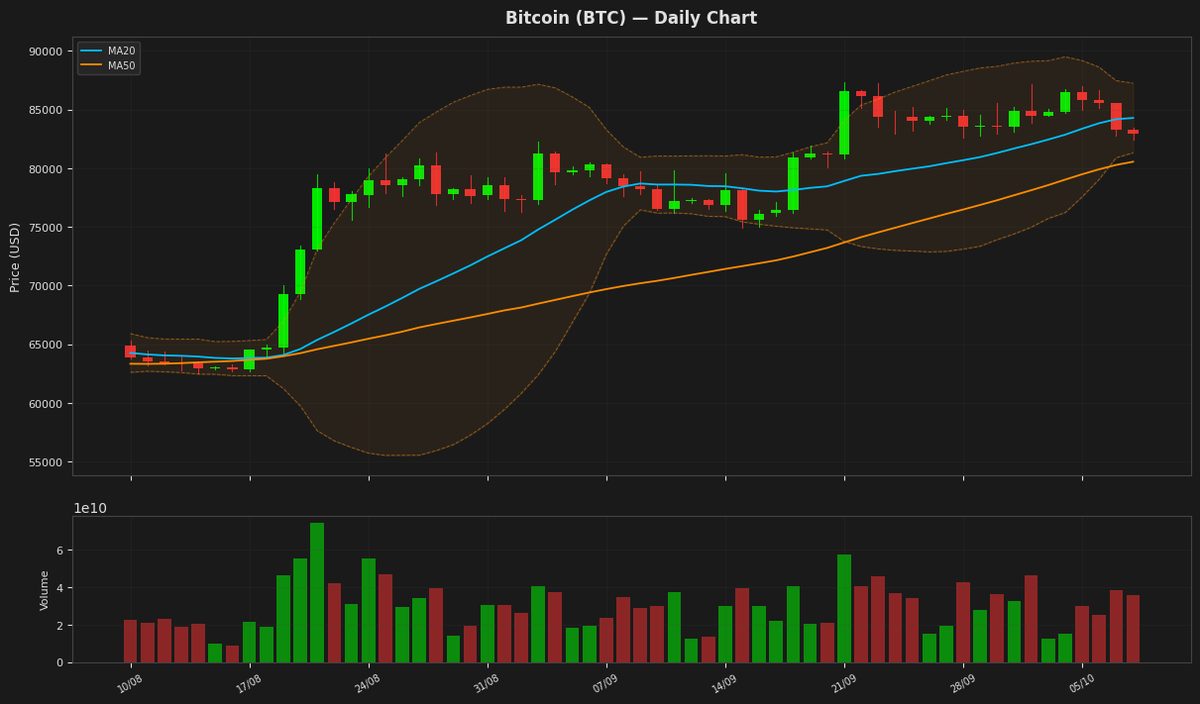
Bitcoin is currently trading at $82,961.34, positioned below its 20-day moving average of $84,283.38, which indicates a short-term bearish trend. The RSI of 42.18 suggests neutral to weak momentum, while the MACD remains below the signal line, confirming a negative crossover. Price action is currently fluctuating between the Bollinger Band limits, with immediate support found near the lower band at $81,313.64.
Ethereum (ETH) — -0.37%
$2,564.09 52W: $1,506.51 — $2,823.91
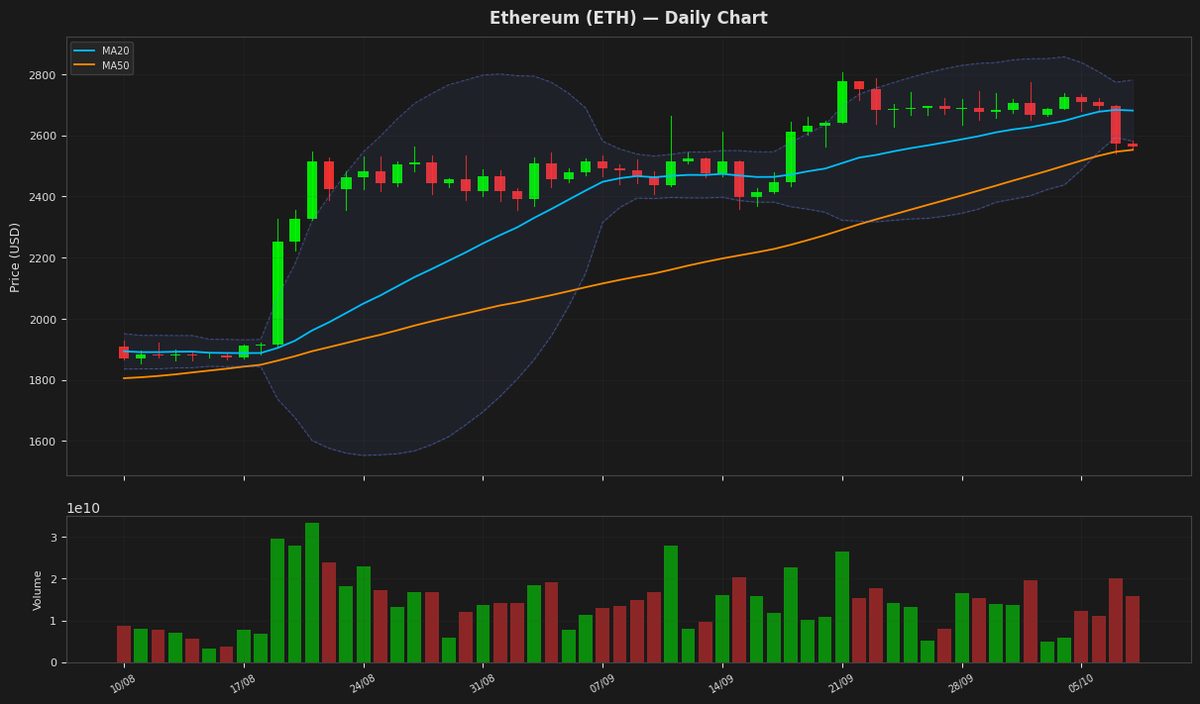
Ethereum's price is currently at $2,564, near the lower Bollinger Band at $2,581, indicating potential support. The RSI is at 30.56, suggesting oversold conditions, while the MACD is below its signal line, indicating a bearish trend. The ATR is at 67.69, showing moderate volatility. Overall, Ethereum may be due for a bounce given its oversold RSI.
Ripple (XRP) — -0.72%
$1.4110 52W: $0.988422 — $1.8093
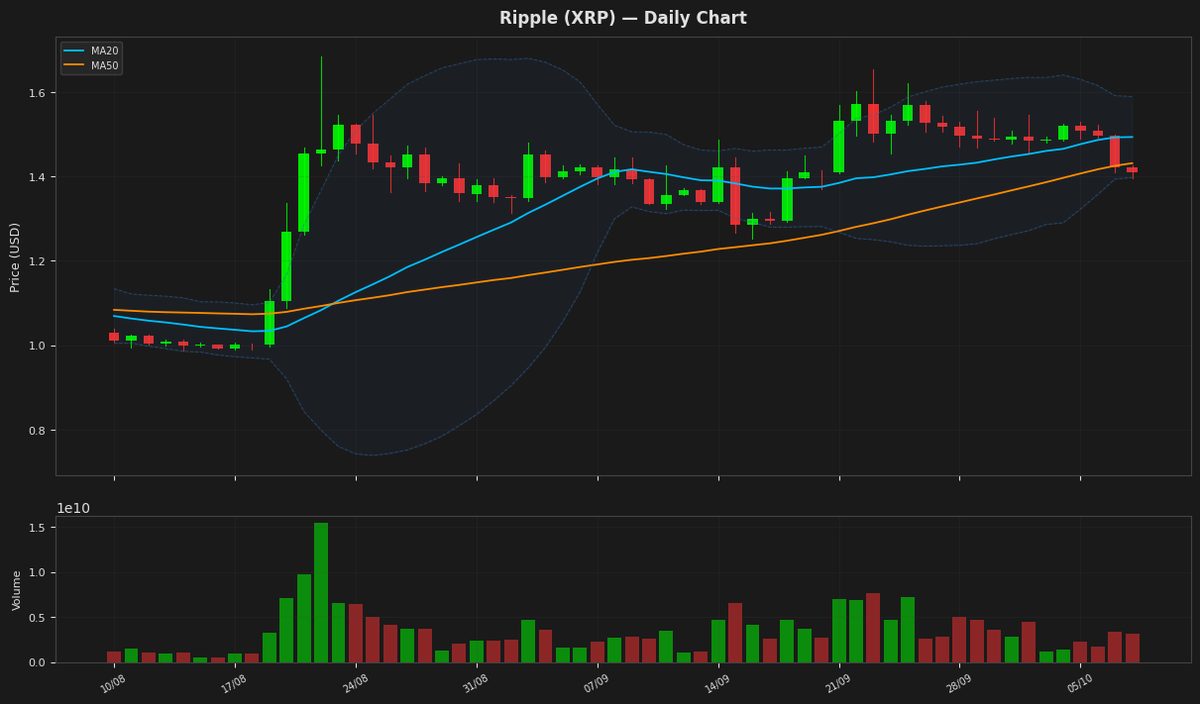
XRP is currently trading at $1.411, positioned below both its 20-day and 50-day moving averages, indicating a short-term bearish trend. The RSI of 27.75 suggests the asset is in oversold territory, while the price is currently testing the lower Bollinger Band support at $1.397. Despite a positive MACD, the value remains below the signal line, confirming a lack of immediate bullish momentum.
Solana (SOL) — -1.06%
$114.9900 52W: $60.4147 — $124.6174
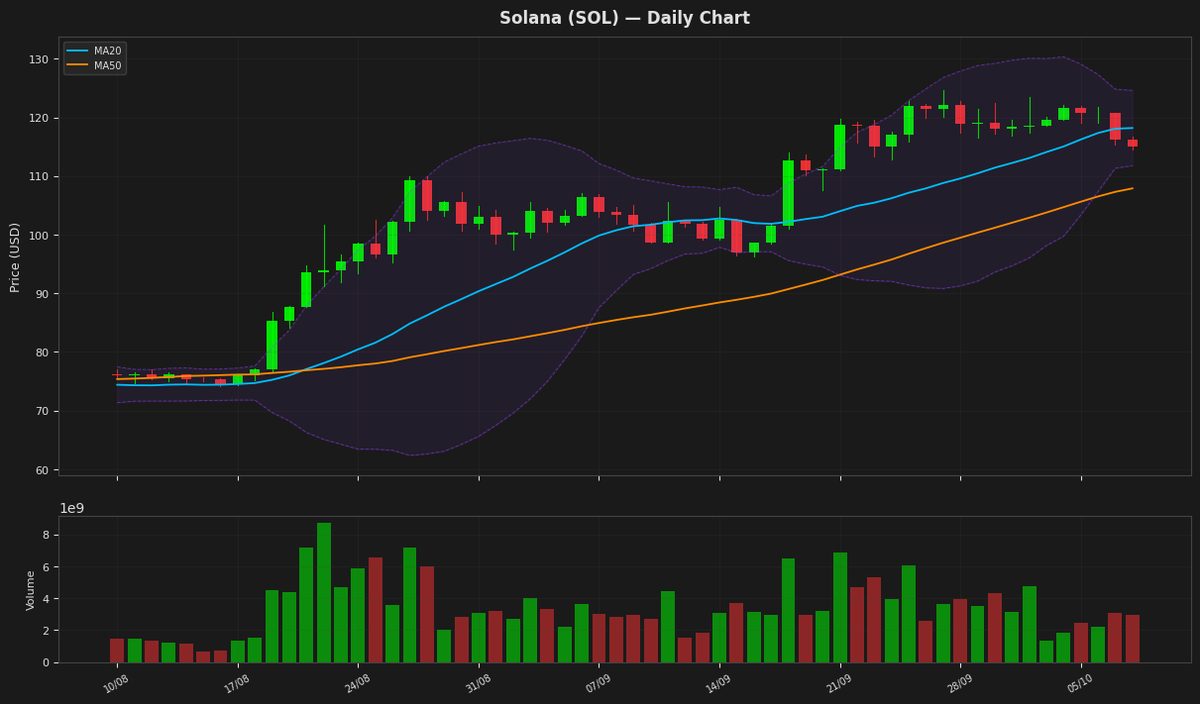
Solana's price is currently at $114.99, showing a slight decline of 1.06%. The RSI at 45.16 indicates a neutral to slightly bearish sentiment, while the MACD being below its signal line suggests a potential continuation of the downtrend. The price is near the lower Bollinger Band at $111.77, indicating potential support in the near term.
BNB (BNB) — -0.54%
$768.1500 52W: $538.5992 — $867.9182
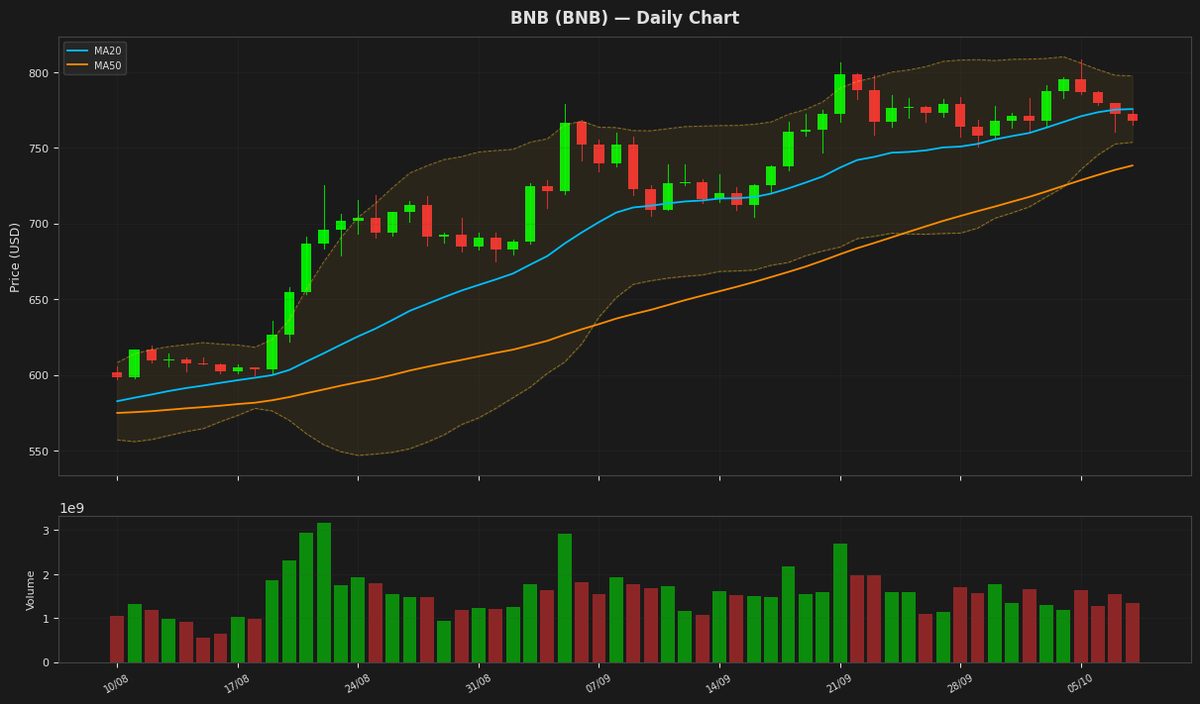
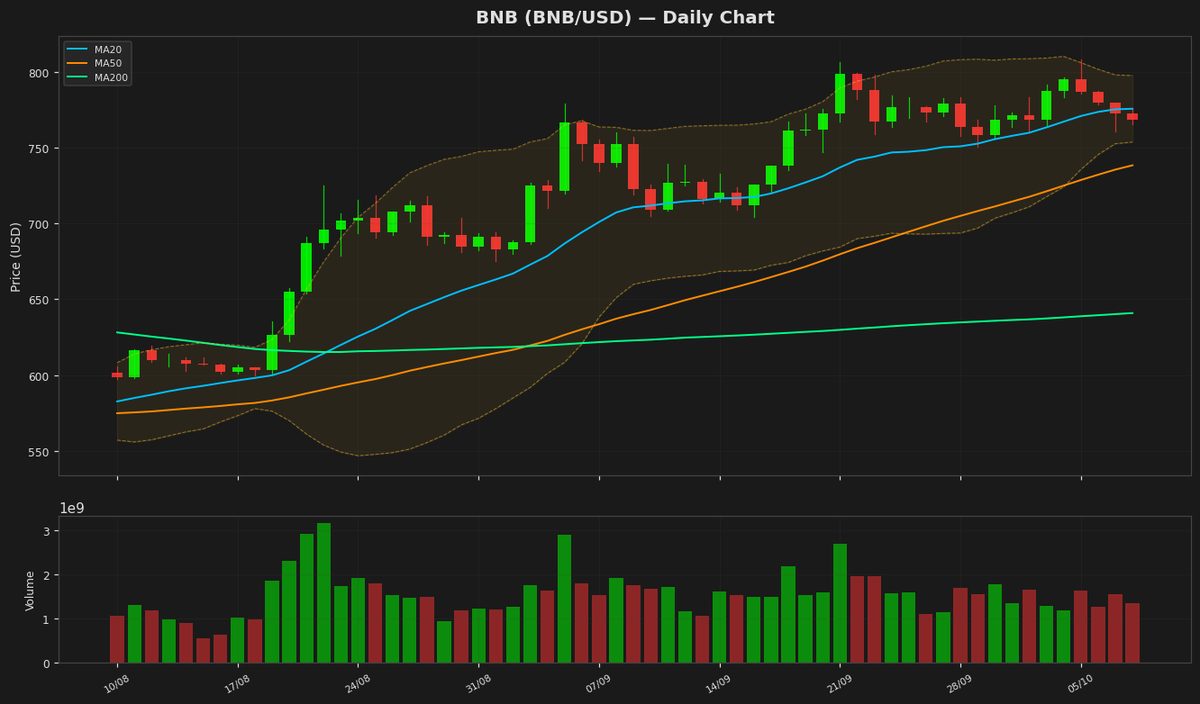
BNB is currently trading at $768.15, slightly below its 20-day moving average of $775.65, indicating a potential short-term downtrend. The Relative Strength Index (RSI) at 45.85 suggests a neutral to slightly bearish sentiment, while the MACD histogram is negative, indicating a potential sell signal. The price is hovering near the lower Bollinger Band at $753.69, suggesting potential support.
Tron (TRX) — -0.13%
$0.334748 52W: $0.268138 — $0.376332
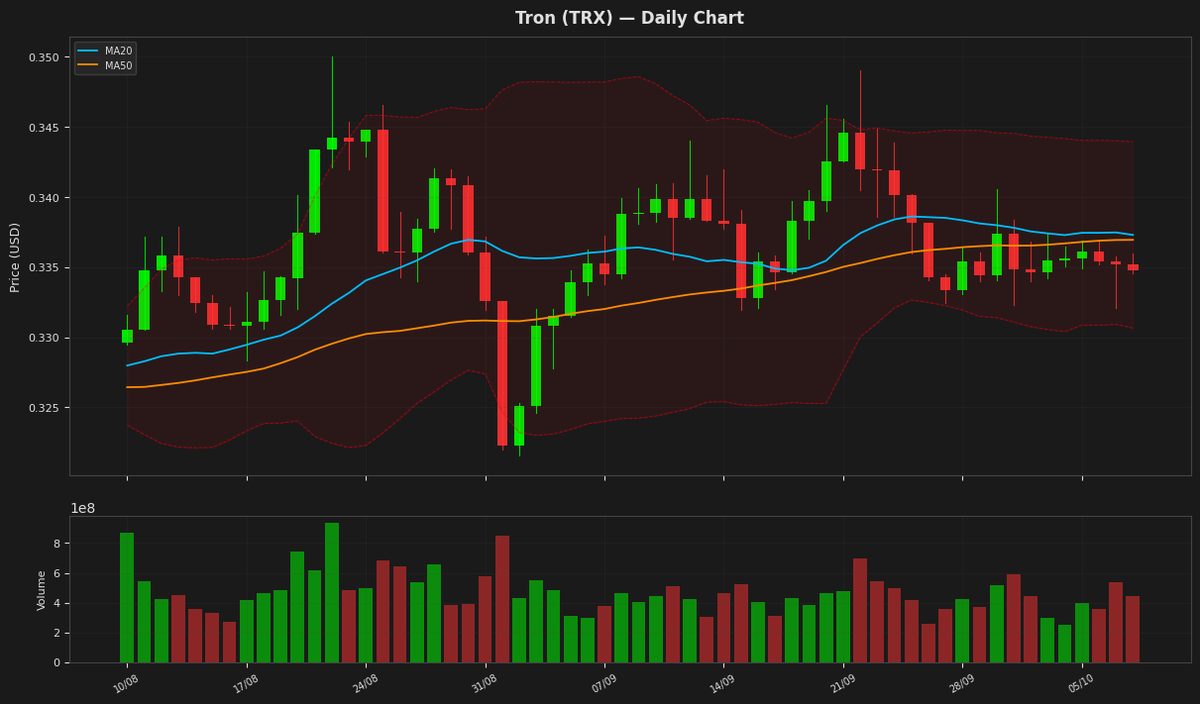
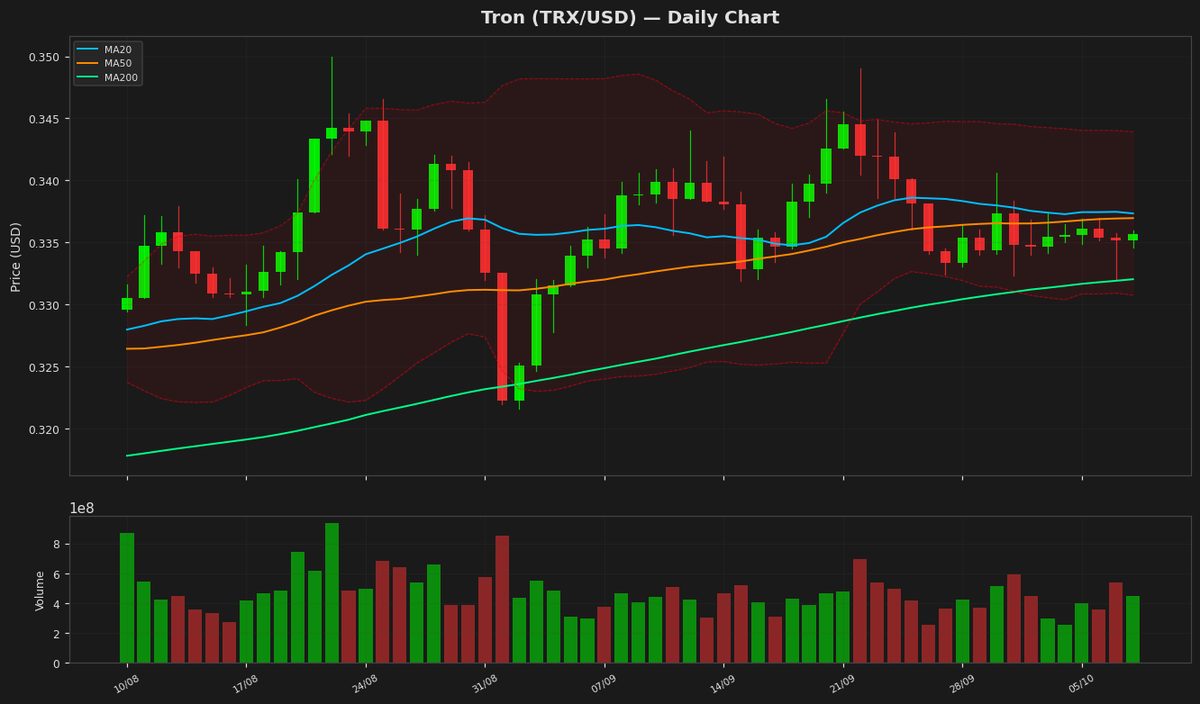
Tron's price is currently at $0.334748, showing a minor decline, and is positioned near the lower end of the Bollinger Bands, indicating potential support around $0.330644. The RSI is at 35.29, suggesting the asset is approaching oversold territory. The MACD is below its signal line, indicating a bearish signal, while the ATR indicates low volatility.
Dogecoin (DOGE) — -1.31%
$0.087810 52W: $0.067973 — $0.118353
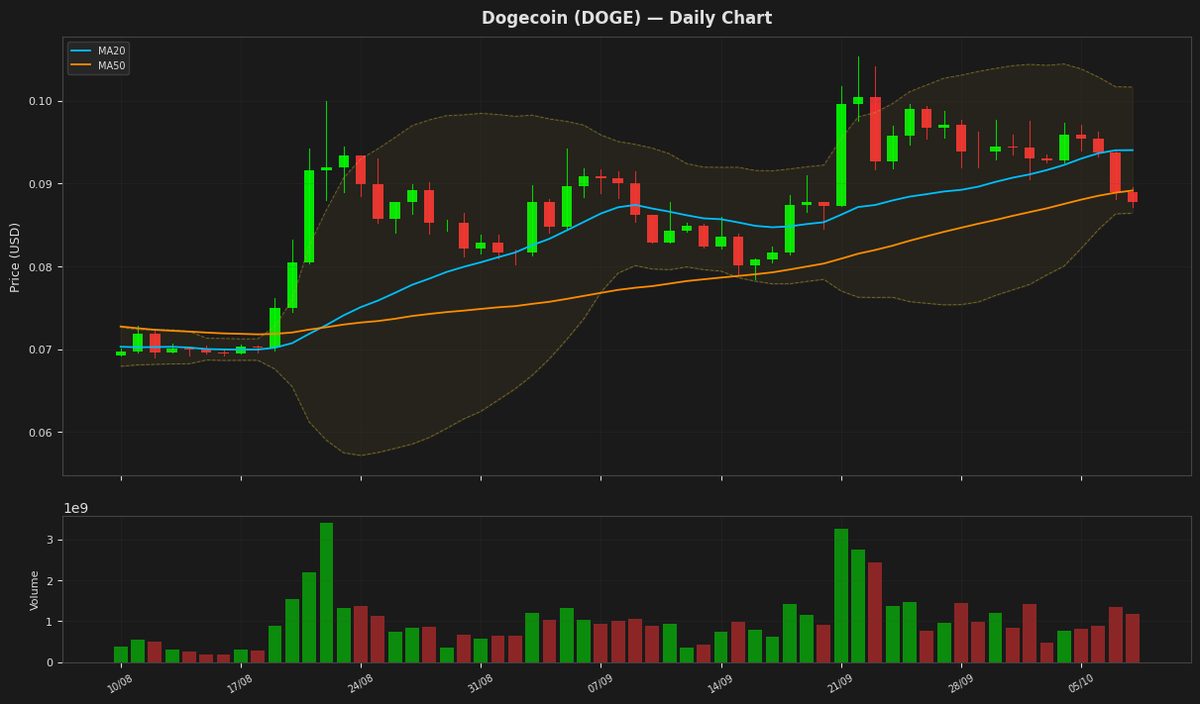
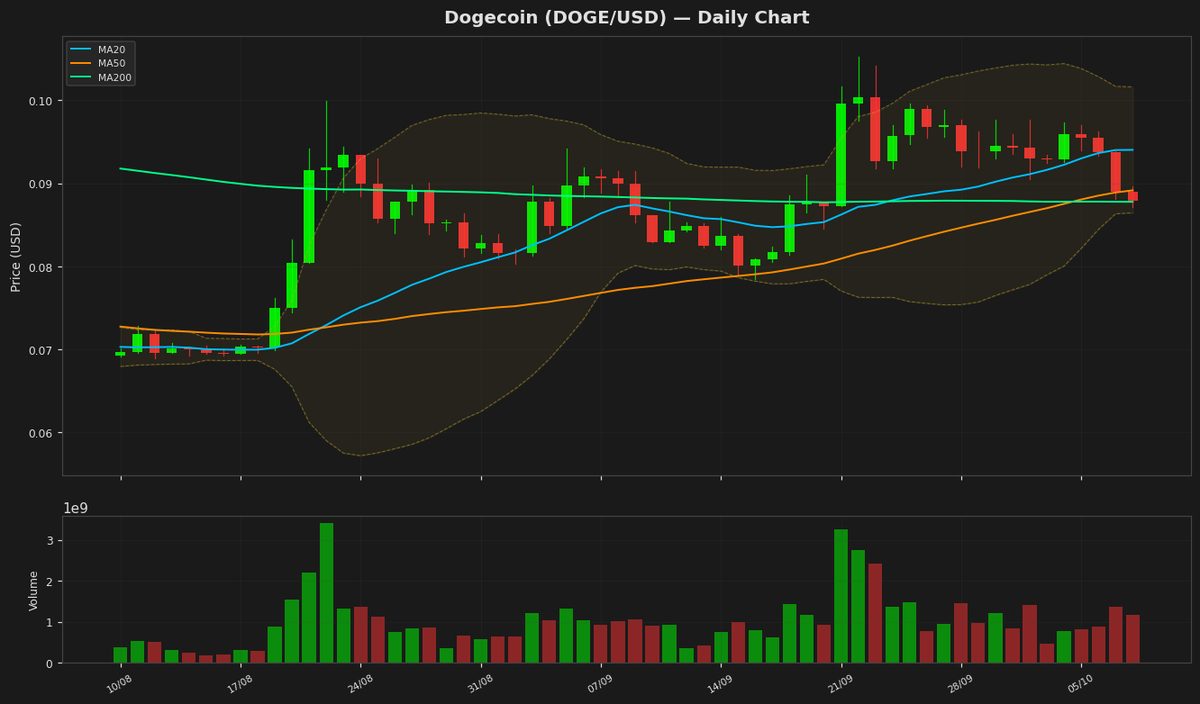
Dogecoin's price is currently at $0.087810, showing a decline of 1.31% for the day, as it trades near the lower Bollinger Band at 0.086411, indicating potential oversold conditions. The RSI(14) value of 32.118741 further supports this, suggesting the cryptocurrency may be due for a bounce. The MACD is below its signal line, indicating a bearish trend, while the ATR(14) suggests moderate volatility.
Disclaimer
The content on MarketsFN.com is provided for educational and informational purposes only. It does not constitute financial advice or investment recommendations. All investments involve risk. Past performance does not guarantee future results.