Crude Oil (WTI): Up 0.6% to $91.53 — Bullish Structure — Above MA50 & MA200
QuoteReporter
•2 min read
Crude Oil (WTI): Up 0.6% to $91.53 — Bullish Structure — Above MA50 & MA200
Analysis Date: September 03, 2026
📊 Current Market Data
CURRENT PRICE
$91.53
DAILY CHANGE
+0.57%
WEEKLY CHANGE
+9.58%
52W HIGH
$119.48
52W LOW
$54.98
💡 Key Market Factors
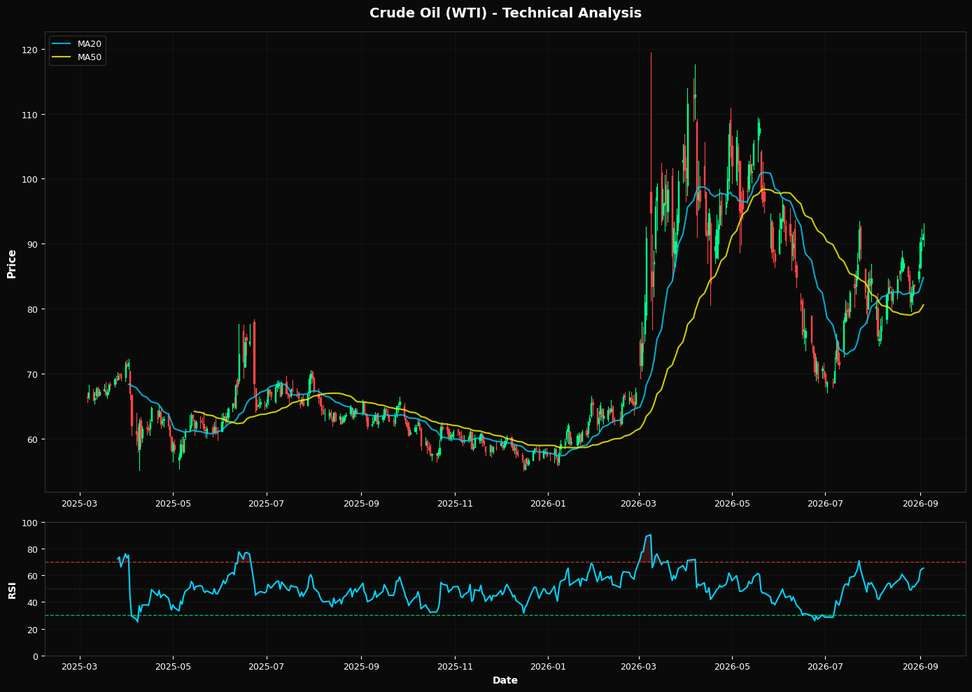
Crude oil's recent surge, with a weekly gain of +9.58%, underscores a market increasingly driven by inflationary pressures rather than just supply-demand fundamentals. The most critical macro driver for WTI right now is inflation, as it directly influences the Federal Reserve's monetary policy and, consequently, the strength of the U.S. dollar. With inflationary concerns persisting, the Fed may be compelled to maintain higher interest rates for longer, which could strengthen the dollar and potentially cap further oil price gains. However, the current price of $91.53 suggests that the market is pricing in a scenario where inflation remains elevated, supporting higher oil prices as a hedge against currency devaluation. From a technical perspective, WTI's positioning is bullish. The Relative Strength Index (RSI) at 65.3 indicates that the commodity is approaching overbought territory, yet it hasn't crossed the critical threshold of 70, suggesting room for further upside. The price is comfortably above its 20-day ($84.78), 50-day ($80.57), and 200-day ($78.66) moving averages, reinforcing a strong upward trend. The nearest Fibonacci support at 38.2% is at $94.84, which could act as a magnet for prices if the current momentum continues. This technical setup suggests a directional bias towards further gains, potentially testing the $94.84 level if macro conditions remain supportive. The key risk to this bullish outlook is a significant shift in U.S. monetary policy. Should upcoming economic data, particularly the Consumer Price Index (CPI), indicate a sharp decline in inflation, the Fed might pivot towards a more dovish stance. This could weaken the dollar and alter the current bullish narrative for crude oil. Conversely, a stronger-than-expected CPI could reinforce the current trajectory, pushing oil prices higher as investors seek inflation hedges. Looking ahead, the upcoming CPI release will be pivotal. A reading that deviates significantly from expectations could either validate the current bullish momentum or prompt a reassessment of the inflationary landscape and its impact on oil prices. This data point will be crucial in determining whether the market's current pricing of inflation risks is justified or if a recalibration is necessary.📈 Technical Indicators Summary
RSI (14)
65.3
50-Day MA
$80.57
200-Day MA
$78.66
Fib Level
38.2%
📊 Technical Analysis Chart (18-Month View)
_tech_20260903_165452.png)
📐 Fibonacci Retracement Analysis
_fib_20260903_165452.png)
🎯 Key Trading Levels
Key Fibonacci Levels:
- 38.2%: $94.84
- 50.0%: $87.23
- 61.8%: $79.62
Support: $54.98 (Swing Low), $80.57 (50-Day MA)
Resistance: $119.48 (Swing High)
Disclaimer
The content on MarketsFN.com is provided for educational and informational purposes only. It does not constitute financial advice, investment recommendations, or trading guidance. All investments involve risks, and past performance does not guarantee future results. You are solely responsible for your investment decisions and should conduct independent research and consult a qualified financial advisor before acting. MarketsFN.com and its authors are not liable for any losses or damages arising from your use of this information.