Crude Oil (WTI) Sells Off 18.0%
MarketsFN Team
•1 min read
Crude Oil (WTI) Sells Off 18.0%
Analysis Date: April 08, 2026
📊 Current Market Data
CURRENT PRICE
$92.61
DAILY CHANGE
-18.01%
WEEKLY CHANGE
-8.65%
52W HIGH
$119.48
52W LOW
$54.98
💡 Key Market Factors
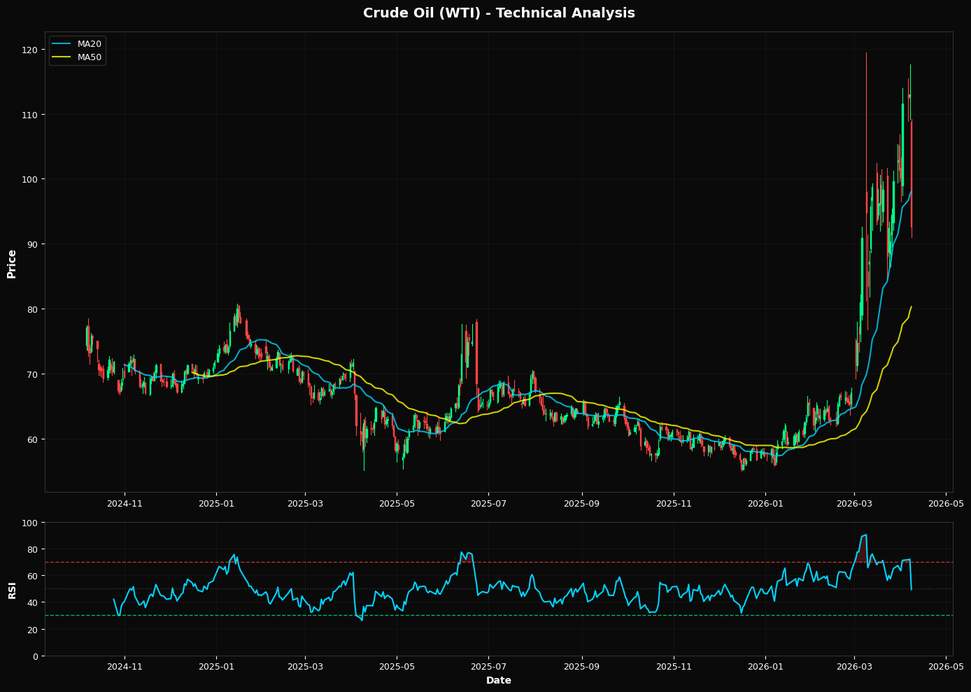
Crude Oil (WTI) is experiencing significant downward pressure, with a daily price drop of 18.01% and a weekly decline of 8.65%. This sharp decline can be partially attributed to rising inflation expectations, which have prompted concerns about reduced consumer spending and slower economic growth, potentially dampening oil demand. Additionally, the Federal Reserve's stance on maintaining higher interest rates to combat inflation may further suppress economic activity, thereby impacting oil consumption. From a geopolitical perspective, there are no major events currently disrupting supply chains or significantly altering demand dynamics. However, ongoing tensions in key oil-producing regions remain a background risk that could influence market sentiment and volatility. Technically, WTI is trading below its 20-day moving average of $98.05, suggesting bearish momentum. The RSI at 49.3 indicates neutral conditions, but the recent price action suggests potential for further downside unless a reversal occurs. Key support is likely near the 50-day moving average of $80.27, while resistance is seen at the Fibonacci level of 38.2% at $94.84, which could act as a pivot point for any recovery attempts.📈 Technical Indicators Summary
RSI (14)
49.3
50-Day MA
$80.27
200-Day MA
$66.49
Fib Level
38.2%
📊 Technical Analysis Chart (18-Month View)
_tech_20260408_143316.png)
📐 Fibonacci Retracement Analysis
_fib_20260408_143316.png)
🎯 Key Trading Levels
Key Fibonacci Levels:
- 38.2% Level: $94.84
- 50.0% Level: $87.23
- 61.8% Level: $79.62
Support: $54.98 (Swing Low), $80.27 (50-day MA)
Resistance: $119.48 (Swing High)
Disclaimer
The content on MarketsFN.com is provided for educational and informational purposes only. It does not constitute financial advice, investment recommendations, or trading guidance. All investments involve risks, and past performance does not guarantee future results. You are solely responsible for your investment decisions and should conduct independent research and consult a qualified financial advisor before acting. MarketsFN.com and its authors are not liable for any losses or damages arising from your use of this information.