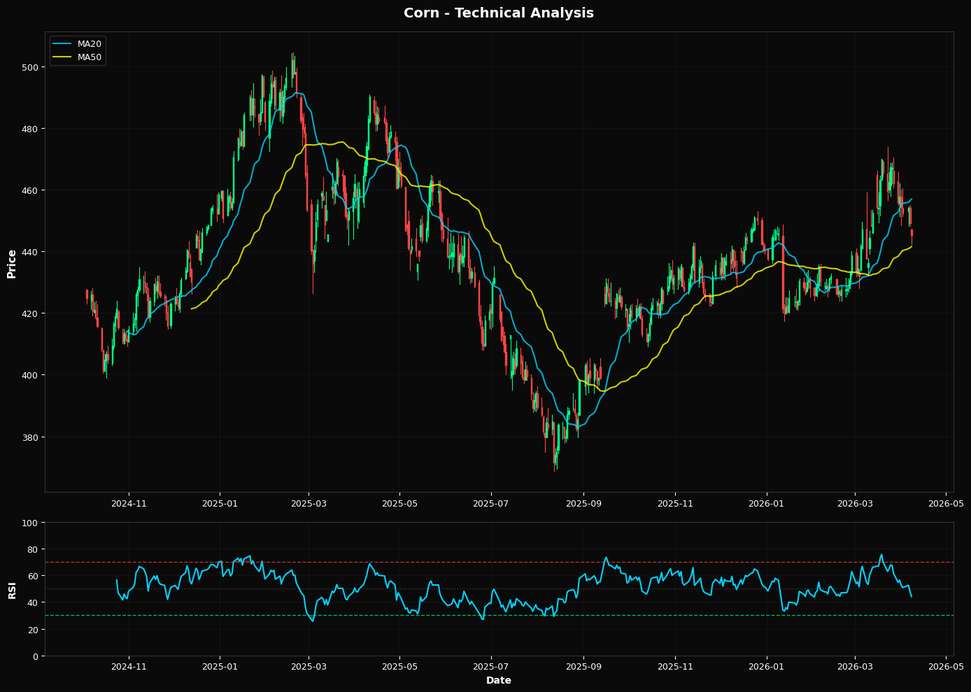
Corn Declines 0.8% near 61.8% Fibonacci support
MarketsFN Team
•1 min read
Corn Declines 0.8% near 61.8% Fibonacci support
Analysis Date: April 08, 2026
📊 Current Market Data
CURRENT PRICE
$445.25
DAILY CHANGE
-0.84%
WEEKLY CHANGE
-2.73%
52W HIGH
$490.75
52W LOW
$368.75
💡 Key Market Factors
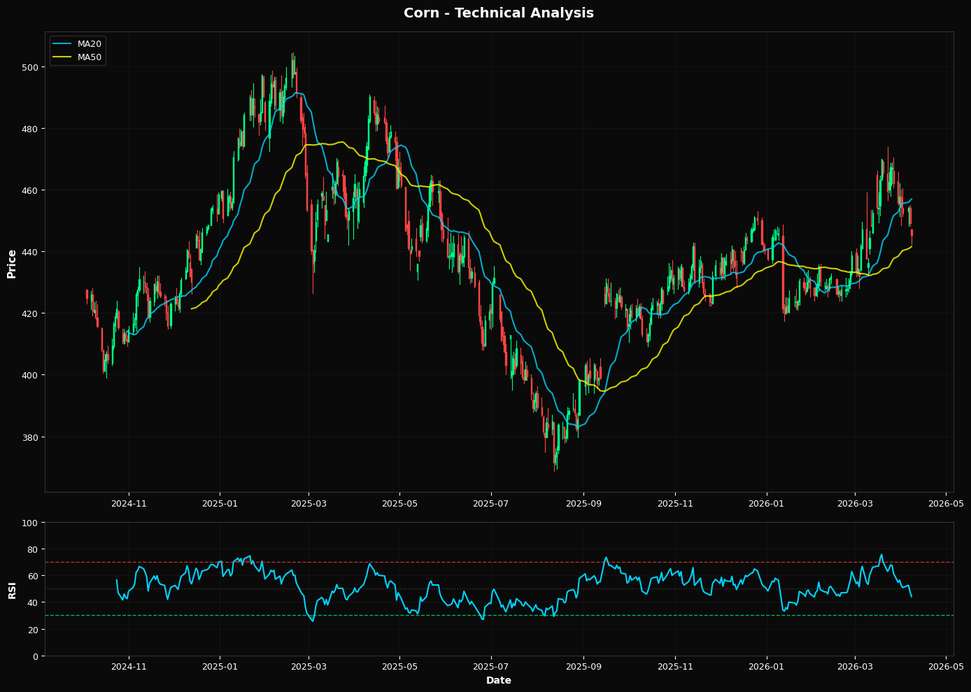
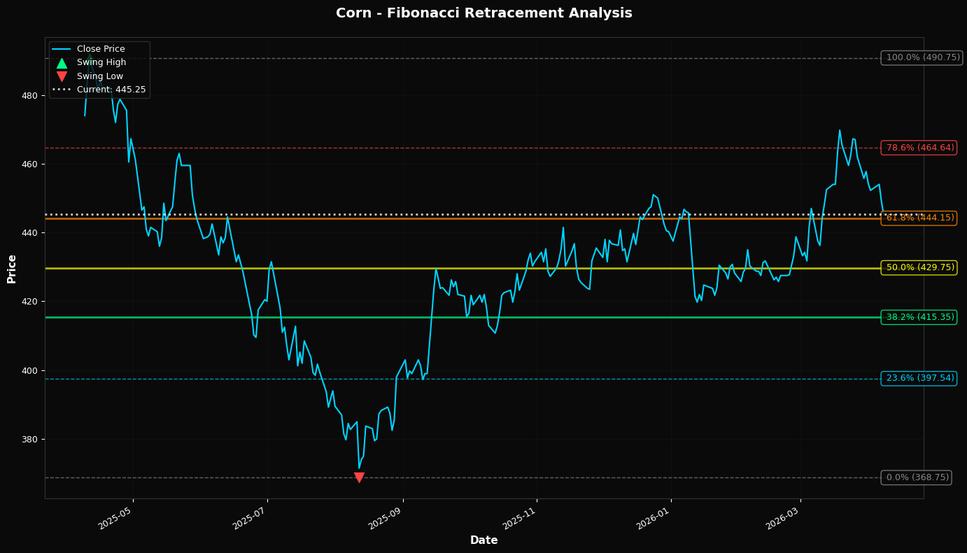
Corn prices are currently experiencing downward pressure, with a daily decline of 0.84% and a weekly drop of 2.73%. Inflation expectations are relatively muted at present, as recent data indicates a stabilization in consumer prices, reducing the urgency for aggressive hedging in commodities like corn. This stabilization in inflation is providing a somewhat neutral backdrop for corn prices, with no immediate inflation-driven demand surge. The Federal Reserve's recent decision to maintain interest rates has kept borrowing costs stable, which indirectly supports agricultural investment but does not provide a significant boost to corn prices. The lack of change in interest rates suggests that macroeconomic conditions remain steady, without introducing new upward or downward pressures on corn. Technically, corn is trading just above a critical Fibonacci support level at $444.15, which could provide a short-term floor for prices. The RSI at 44.1 indicates that corn is neither overbought nor oversold, suggesting a neutral momentum. The price is below the 20-day moving average of $456.90 but remains slightly above the 50-day moving average of $441.52, indicating a mixed technical outlook with potential for stabilization if support levels hold.📈 Technical Indicators Summary
RSI (14)
44.1
50-Day MA
$441.52
200-Day MA
$423.63
Fib Level
61.8%
📊 Technical Analysis Chart (18-Month View)
📐 Fibonacci Retracement Analysis
🎯 Key Trading Levels
Key Fibonacci Levels:
- 38.2% Level: $415.35
- 50.0% Level: $429.75
- 61.8% Level: $444.15
Support: $368.75 (Swing Low), $441.52 (50-day MA)
Resistance: $490.75 (Swing High)
Disclaimer
The content on MarketsFN.com is provided for educational and informational purposes only. It does not constitute financial advice, investment recommendations, or trading guidance. All investments involve risks, and past performance does not guarantee future results. You are solely responsible for your investment decisions and should conduct independent research and consult a qualified financial advisor before acting. MarketsFN.com and its authors are not liable for any losses or damages arising from your use of this information.