Copper Rallies 3.7% near 38.2% Fibonacci resistance
MarketsFN Team
•1 min read
Copper Rallies 3.7% near 38.2% Fibonacci resistance
Analysis Date: April 08, 2026
📊 Current Market Data
CURRENT PRICE
$5.75
DAILY CHANGE
+3.69%
WEEKLY CHANGE
+2.89%
52W HIGH
$6.51
52W LOW
$4.10
💡 Key Market Factors
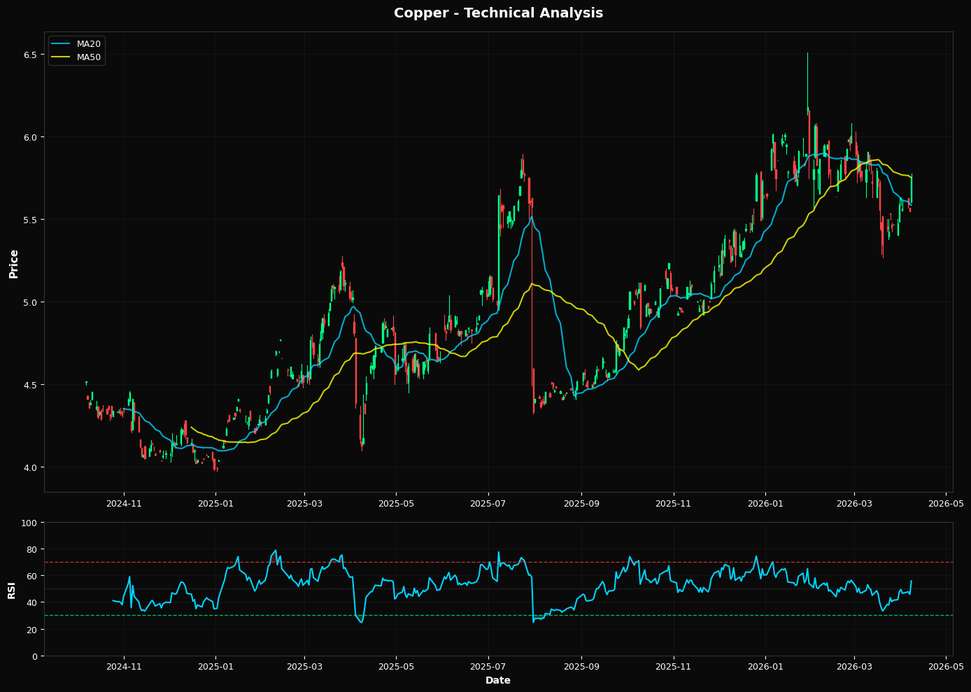
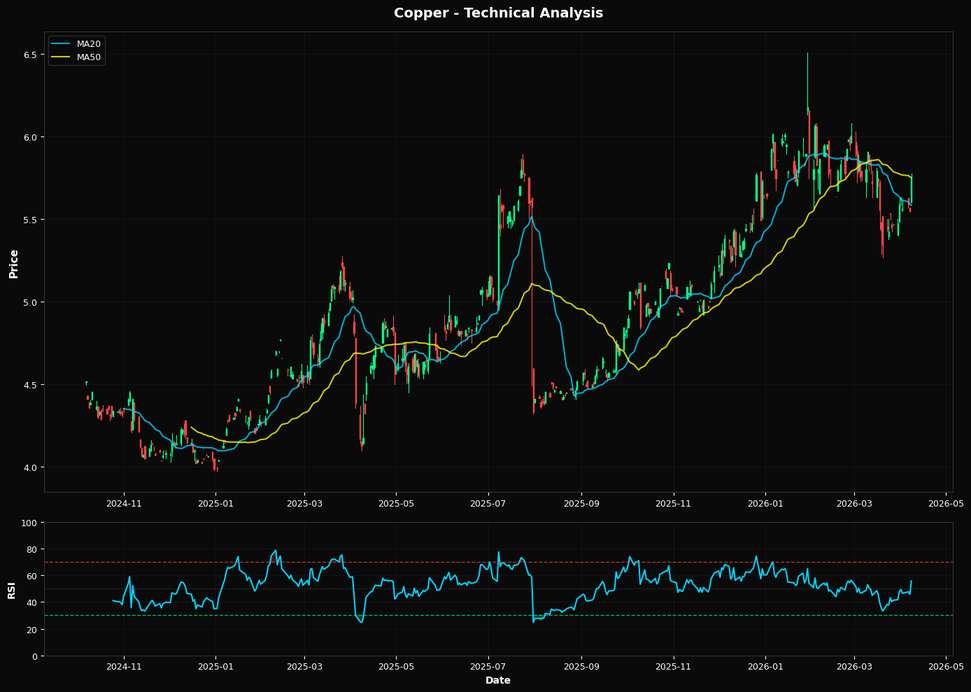
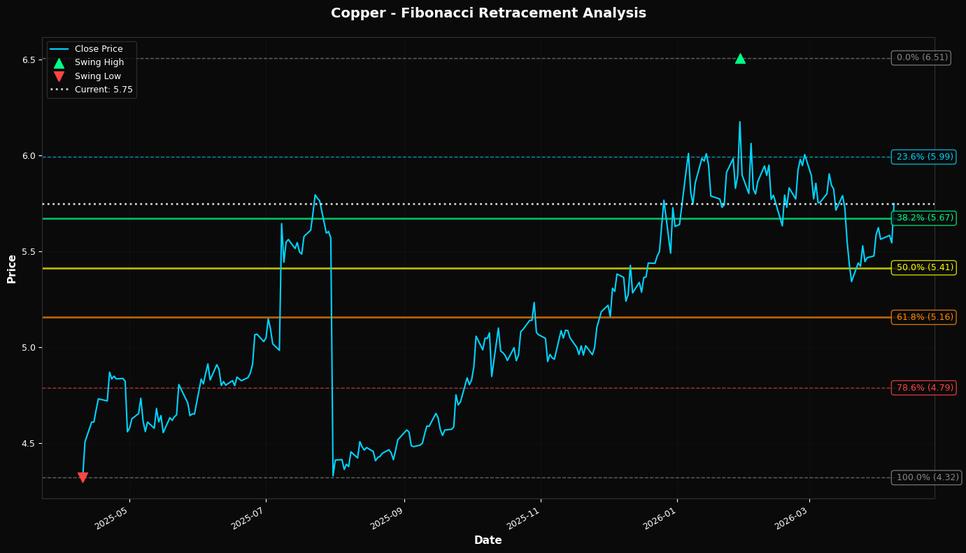
Copper prices are currently experiencing upward momentum, with a daily increase of 3.69% and a weekly rise of 2.89%. Inflation expectations remain a critical factor, as persistent inflationary pressures could bolster demand for copper as a hedge, while also impacting production costs. However, current inflation data suggests a moderated impact, keeping the focus on other macroeconomic factors. Interest rate policies, particularly from the Federal Reserve, are crucial as they influence global economic growth prospects and industrial demand for copper. The Fed's recent indications of maintaining a cautious stance on further rate hikes could support copper prices by fostering a more favorable economic environment, potentially boosting industrial activity and demand. Technically, copper is trading above its 20-day moving average of $5.58, suggesting short-term bullish momentum, while it aligns with the 50-day moving average at $5.75, indicating a potential consolidation phase. The RSI of 55.7 suggests neither overbought nor oversold conditions, providing room for further price movement. Key support is seen at the Fibonacci level of 38.2% at $5.67, with resistance likely at recent highs, necessitating close monitoring of these levels for potential breakout or reversal signals.📈 Technical Indicators Summary
RSI (14)
55.7
50-Day MA
$5.75
200-Day MA
$5.25
Fib Level
38.2%
📊 Technical Analysis Chart (18-Month View)
📐 Fibonacci Retracement Analysis
🎯 Key Trading Levels
Key Fibonacci Levels:
- 38.2% Level: $5.67
- 50.0% Level: $5.41
- 61.8% Level: $5.16
Support: $4.32 (Swing Low), $5.75 (50-day MA)
Resistance: $6.51 (Swing High)
Disclaimer
The content on MarketsFN.com is provided for educational and informational purposes only. It does not constitute financial advice, investment recommendations, or trading guidance. All investments involve risks, and past performance does not guarantee future results. You are solely responsible for your investment decisions and should conduct independent research and consult a qualified financial advisor before acting. MarketsFN.com and its authors are not liable for any losses or damages arising from your use of this information.