CAC 40: Down 0.10% to 8,475.68 — RSI Signals Oversold
MarketsFN Team
CAC 40: Down 0.10% to 8,475.68 — RSI Signals Oversold
Published: August 24, 2026 · MarketsFN Team
| Index | Price | Change | RSI(14) | SMA-20 | 52W High | 52W Low |
|---|---|---|---|---|---|---|
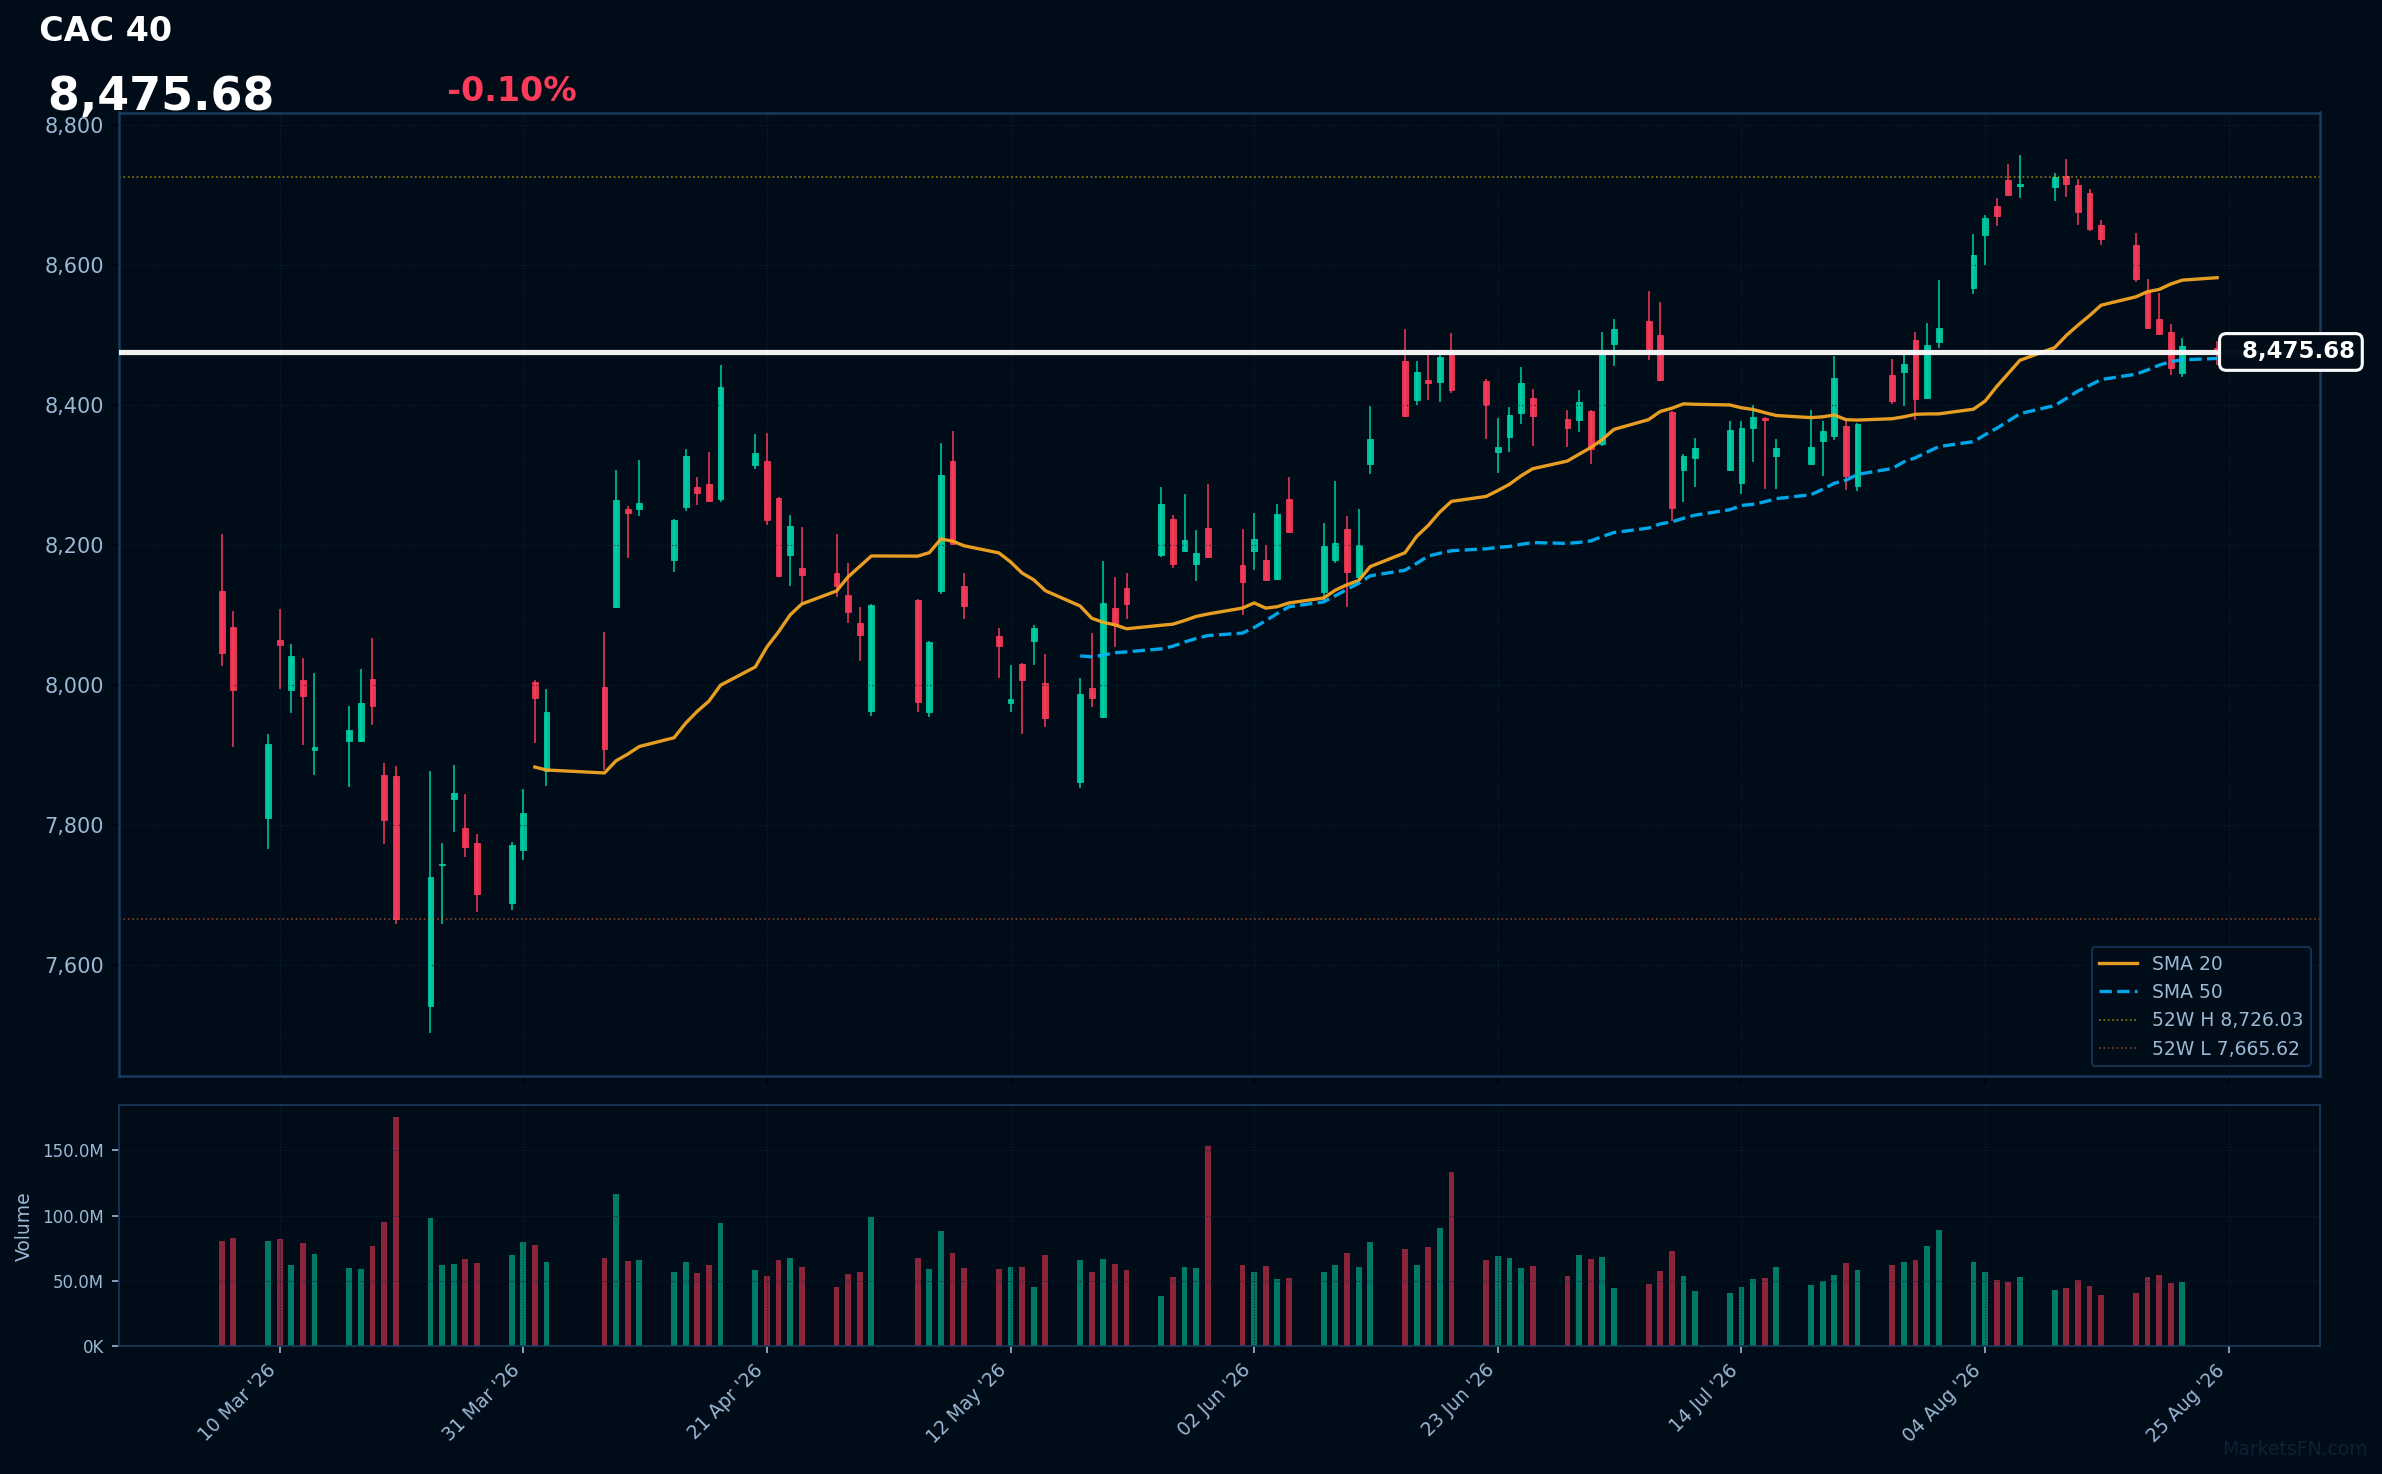
| CAC 40 | 8,475.68 | -0.10% | 24.4 | 8,581.70 | 8,726.03 | 7,665.62 |
The CAC 40 is actively quoting at 8,475.68 (-0.10%), reflecting a slight decline as market participants digest recent economic data and geopolitical tensions. This minor pullback signals a cautious sentiment among investors, particularly as the index remains below its 20-day simple moving average (SMA-20) of 8,581.70, indicating potential weakness in upward momentum.
From a technical perspective, the index is currently positioned above its 50-day simple moving average (SMA-50) of 8,466.38, which may provide a critical support level. However, with an RSI(14) reading of 24.4, the CAC 40 is firmly in oversold territory, suggesting that a rebound could be imminent if buying interest returns. The index is also trading near its 52-week low of 7,665.62, which underscores the importance of monitoring this level for signs of further downside.
Looking ahead, the CAC 40 faces resistance at the 20-day SMA of 8,581.70, while immediate support is established at the 50-day SMA of 8,466.38. A decisive move above the SMA-20 could signal a shift in sentiment and a potential recovery phase for the index.
Disclaimer
The content on MarketsFN.com is provided for educational and informational purposes only. It does not constitute financial advice or investment recommendations. All investments involve risks and past performance does not guarantee future results. You are solely responsible for your investment decisions.