BNB is currently testing the $577.50 resistance level, with the RSI showing signs of a potential reversal. The Relative Strength Index (RSI) is a key indicator to watch, as it suggests that BNB might be gearing up for a bullish breakout if the resistance is breached. Key Levels to Watch: - Resistance: $577.50 (critical breakout level) - Support: $550 (short-term support) RSI Analysis: The RSI is hovering around the mid-range, indicating neither overbought nor oversold conditions. A move above 60 could signal increasing bullish momentum, while a drop below 40 might suggest further downside. Potential Scenarios: 1. Bullish Breakout: If BNB clears $577.50 with strong volume, the next target could be $600 and beyond. 2. Rejection at Resistance: Failure to break $577.50 could lead to a retest of $550 or lower support levels. Traders should monitor the RSI closely for confirmation of a trend reversal and watch for volume spikes to validate any breakout attempts.
Reporter España
•4 min read
BNB is currently testing the $577.50 resistance level, with the RSI showing signs of a potential reversal. The Relative Strength Index (RSI) is a key indicator to watch, as it suggests that BNB might be gearing up for a bullish breakout if the resistance is breached. Key Levels to Watch: - Resistance: $577.50 (critical breakout level) - Support: $550 (short-term support) RSI Analysis: The RSI is hovering around the mid-range, indicating neither overbought nor oversold conditions. A move above 60 could signal increasing bullish momentum, while a drop below 40 might suggest further downside. Potential Scenarios: 1. Bullish Breakout: If BNB clears $577.50 with strong volume, the next target could be $600 and beyond. 2. Rejection at Resistance: Failure to break $577.50 could lead to a retest of $550 or lower support levels. Traders should monitor the RSI closely for confirmation of a trend reversal and watch for volume spikes to validate any breakout attempts.
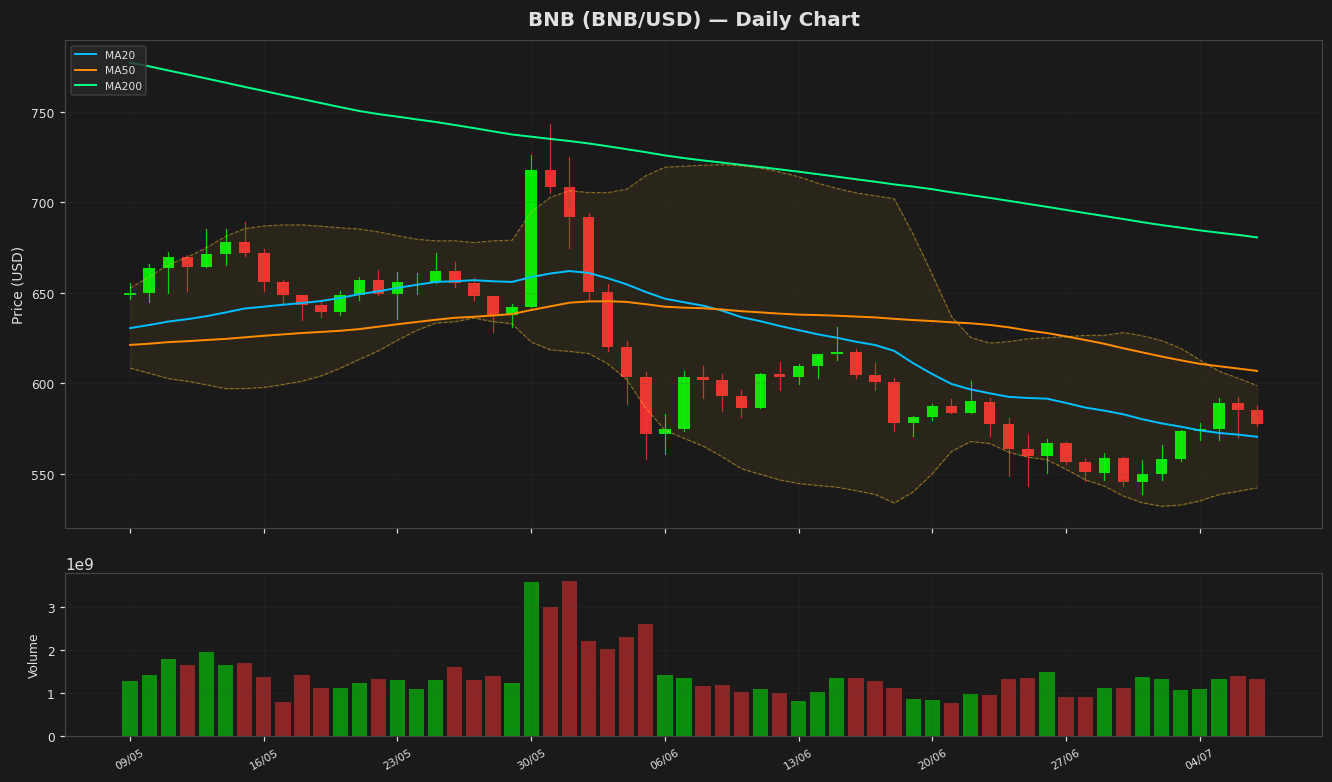
BNB (BNB/USD) | July 07, 2026 $577.5000 -1.36%
🔍 Technical Analysis
BNB cotiza actualmente en $577.50, con una caída del 1.36% en el día, mostrando una leve presión bajista. El precio se mantiene justo por encima de la media móvil de 20 días (MA20) en $570.42, lo que sugiere un soporte a corto plazo, mientras que la MA50 en $606.83 y la MA200 en $680.64 indican niveles de resistencia a más largo plazo. Las Bandas de Bollinger muestran un rango que se estrecha, con la banda superior en $598.69 y la banda inferior en $542.14, señalando una volatilidad reducida y una posible consolidación. El RSI en 49.96 es neutral, ni sobrecomprado ni sobrevendido, reflejando un sentimiento de mercado equilibrado. El histograma MACD en -7.75 permanece por debajo de la línea de señal en -12.62, indicando un impulso bajista persistente, aunque el estrechamiento de la brecha sugiere una presión a la baja cada vez menor. El soporte clave se encuentra cerca de la MA20 y la Banda de Bollinger inferior alrededor de $542, mientras que la resistencia se ubica en la MA50 ($606.83) y la Banda de Bollinger superior ($598.69). El máximo de 52 semanas en $1,123.70 y el máximo del año hasta la fecha en $954.86 destacan un potencial alcista significativo, pero el precio actual sigue estando muy por debajo de estos niveles. El ATR en 18.26 sugiere una volatilidad moderada. Una ruptura por encima de la MA50 podría indicar un impulso alcista, mientras que la incapacidad de mantener el soporte de la MA20 podría llevar a una nueva prueba de la Banda de Bollinger inferior.
Technical Metrics
| Metric | Value |
|---|---|
| Current Price | $577.5000 |
| Daily Change | -1.36% |
| MA 20 | $570.4172 |
| % from MA20 | +1.24% |
| MA 50 | $606.8319 |
| % from MA50 | -4.83% |
| MA 200 | $680.6388 |
| % from MA200 | -15.15% |
| BB Upper | $598.6944 |
| % from BB Upper | -3.54% |
| BB Lower | $542.1399 |
| % from BB Lower | +6.52% |
| RSI (14) | 49.96 |
| MACD | -7.756806 |
| MACD Signal | -12.623149 |
| ATR (14) | 18.262133 |
| 3-Day High | $592.1600 |
| 3-Day Low | $568.5374 |
| 52-Week High | $1,123.6969 |
| % from 52W High | -48.61% |
| 52-Week Low | $538.5992 |
| % from 52W Low | +7.22% |
| YTD High | $954.8583 |
| % from YTD High | -39.52% |
| YTD Low | $538.5992 |
| % from YTD Low | +7.22% |
📊 Market Commentary
BNB cotiza actualmente en $577.50, con una caída del 1.36% hoy, mientras el mercado cripto en general muestra sentimientos mixtos. El Índice de Fuerza Relativa (RSI) se sitúa en 50.0, indicando un impulso neutral, sin condiciones de sobrecompra ni sobreventa. En las últimas 52 semanas, BNB ha oscilado entre $538.60 y $1,123.70, reflejando una volatilidad significativa y una fuerte recuperación desde su mínimo anual.
El sentimiento del mercado en torno a BNB se mantiene cauteloso pero estable, con operadores monitoreando de cerca niveles clave de soporte y resistencia. La zona de $550-$560 se percibe como soporte inmediato, habiéndose mantenido durante retrocesos recientes. Una ruptura por debajo de este nivel podría probar el mínimo anual cercano a $538.60. Al alza, se observa resistencia alrededor de $600, una barrera psicológica que anteriormente ha desencadenado toma de ganancias.
Los traders también están atentos a las tendencias generales del mercado, incluyendo el desempeño de Bitcoin y los desarrollos regulatorios que impactan a Binance, la plataforma nativa de BNB. La utilidad del token dentro del ecosistema Binance sigue generando demanda subyacente, aunque factores macroeconómicos y la liquidez del mercado cripto siguen siendo influyentes.
Las tendencias de volumen se analizan en busca de señales de acumulación o distribución, mientras que el RSI neutral sugiere una posible fase de consolidación. Sin un sesgo direccional claro, los operadores a corto plazo podrían mantenerse en rangos, esperando una ruptura o caída decisiva. En general, el movimiento de precio de BNB refleja un equilibrio entre optimismo cauteloso e incertidumbre a corto plazo.
El sentimiento del mercado en torno a BNB se mantiene cauteloso pero estable, con operadores monitoreando de cerca niveles clave de soporte y resistencia. La zona de $550-$560 se percibe como soporte inmediato, habiéndose mantenido durante retrocesos recientes. Una ruptura por debajo de este nivel podría probar el mínimo anual cercano a $538.60. Al alza, se observa resistencia alrededor de $600, una barrera psicológica que anteriormente ha desencadenado toma de ganancias.
Los traders también están atentos a las tendencias generales del mercado, incluyendo el desempeño de Bitcoin y los desarrollos regulatorios que impactan a Binance, la plataforma nativa de BNB. La utilidad del token dentro del ecosistema Binance sigue generando demanda subyacente, aunque factores macroeconómicos y la liquidez del mercado cripto siguen siendo influyentes.
Las tendencias de volumen se analizan en busca de señales de acumulación o distribución, mientras que el RSI neutral sugiere una posible fase de consolidación. Sin un sesgo direccional claro, los operadores a corto plazo podrían mantenerse en rangos, esperando una ruptura o caída decisiva. En general, el movimiento de precio de BNB refleja un equilibrio entre optimismo cauteloso e incertidumbre a corto plazo.
Aviso Legal
El contenido de MarketsFN.com se proporciona únicamente con fines educativos e informativos. No constituye asesoramiento financiero. Los mercados de criptomonedas son altamente volátiles. Los rendimientos pasados no garantizan resultados futuros.