Bitcoin Slips to $79,586: RSI 65.9 Signals Market Shift
QuoteReporter
•3 min read
Bitcoin Slips to $79,586: RSI 65.9 Signals Market Shift
Bitcoin (BTC/USD) | May 13, 2026 $79,586.0000 -1.11%
🔍 Technical Analysis
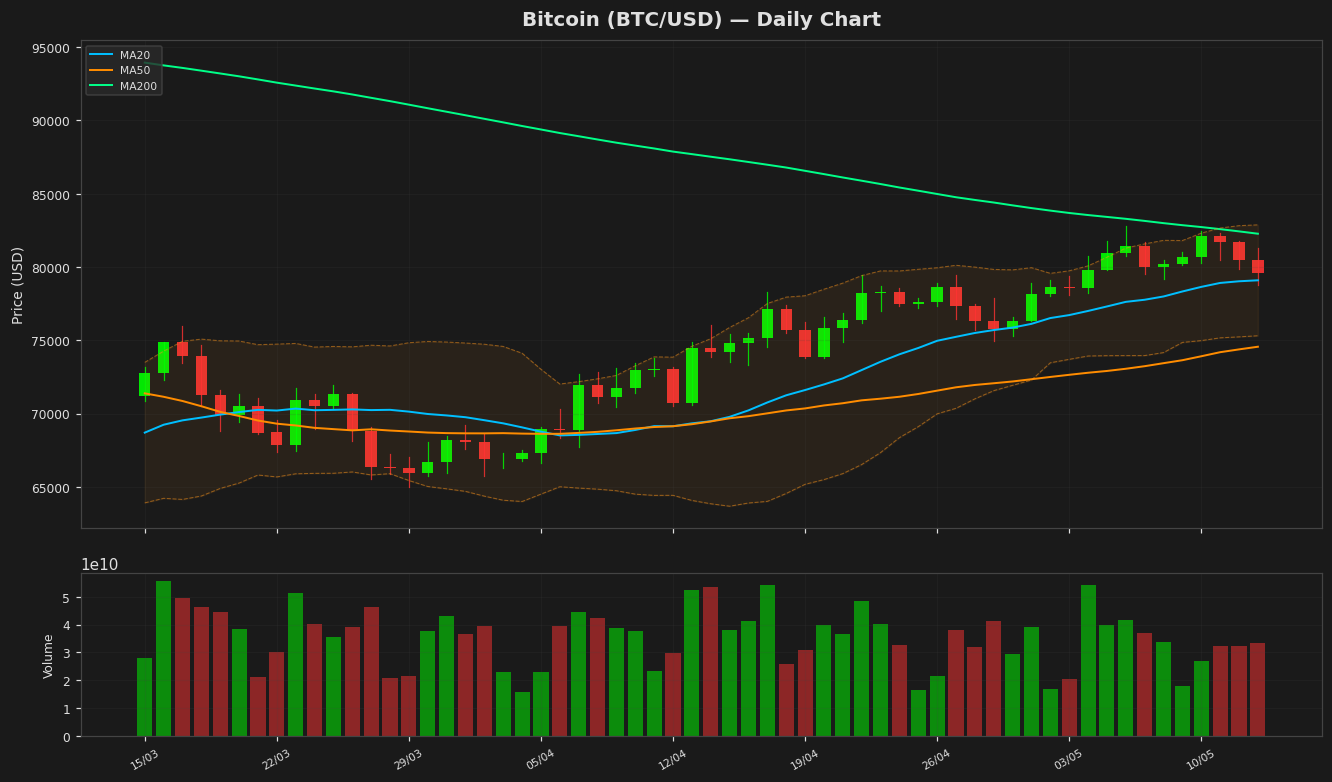
Bitcoin (BTC) is currently trading at $79,586, reflecting a daily decline of 1.11%. The price action shows a consolidation phase after recent bullish momentum, with BTC hovering near key moving averages. The 20-day moving average (MA20) stands at $79,093.57, acting as immediate support, while the 50-day moving average (MA50) at $74,563.80 provides a stronger base. However, the 200-day moving average (MA200) at $82,270.71 looms as resistance, suggesting potential challenges for sustained upward movement.
Analyzing Bollinger Bands, the upper band at $82,874.96 aligns closely with the MA200, reinforcing resistance, while the lower band at $75,312.19 offers a downside buffer near the MA50. The Relative Strength Index (RSI) at 65.89 indicates Bitcoin is approaching overbought territory, hinting at a possible pullback if momentum wanes. The MACD line at 1,676.10 remains below the signal line at 1,827.11, signaling weakening bullish momentum and a potential bearish crossover if the trend persists.
Key support levels to watch are $75,312 (BB Lower) and $74,563 (MA50), while resistance is evident at $82,270 (MA200) and $82,874 (BB Upper). With an ATR of 1,830.56, volatility remains moderate, suggesting potential for sharp moves if these levels are breached. Traders should monitor for confirmation of direction, as BTC remains at a critical juncture between breakout and correction.
Analyzing Bollinger Bands, the upper band at $82,874.96 aligns closely with the MA200, reinforcing resistance, while the lower band at $75,312.19 offers a downside buffer near the MA50. The Relative Strength Index (RSI) at 65.89 indicates Bitcoin is approaching overbought territory, hinting at a possible pullback if momentum wanes. The MACD line at 1,676.10 remains below the signal line at 1,827.11, signaling weakening bullish momentum and a potential bearish crossover if the trend persists.
Key support levels to watch are $75,312 (BB Lower) and $74,563 (MA50), while resistance is evident at $82,270 (MA200) and $82,874 (BB Upper). With an ATR of 1,830.56, volatility remains moderate, suggesting potential for sharp moves if these levels are breached. Traders should monitor for confirmation of direction, as BTC remains at a critical juncture between breakout and correction.
Technical Metrics
| Metric | Value |
|---|---|
| Current Price | $79,586.0000 |
| Daily Change | -1.11% |
| MA 20 | $79,093.5715 |
| % from MA20 | +0.62% |
| MA 50 | $74,563.8005 |
| % from MA50 | +6.74% |
| MA 200 | $82,270.7094 |
| % from MA200 | -3.26% |
| BB Upper | $82,874.9579 |
| % from BB Upper | -3.97% |
| BB Lower | $75,312.1850 |
| % from BB Lower | +5.67% |
| RSI (14) | 65.89 |
| MACD | 1676.097592 |
| MACD Signal | 1827.105446 |
| ATR (14) | 1830.563058 |
| 3-Day High | $82,326.2344 |
| 3-Day Low | $78,742.8047 |
| 52-Week High | $126,198.0703 |
| % from 52W High | -36.94% |
| 52-Week Low | $60,074.2031 |
| % from 52W Low | +32.48% |
| YTD High | $97,860.6016 |
| % from YTD High | -18.67% |
| YTD Low | $60,074.2031 |
| % from YTD Low | +32.48% |
📊 Market Commentary
Bitcoin (BTC) is currently trading at $79,586.00, reflecting a 1.11% decline over the past 24 hours. Despite this dip, market sentiment remains cautiously optimistic as BTC continues to hold above key psychological and technical levels. The Relative Strength Index (RSI) stands at 65.9, indicating that the asset is approaching overbought territory but has not yet crossed the critical threshold of 70, suggesting there is still room for potential momentum before a reversal might be signaled. Traders are closely monitoring this metric for signs of overextension.
Within its 52-week range of $60,074.20 to $126,198.07, Bitcoin's current price sits comfortably above the lower bound, reflecting sustained strength from earlier gains in the year. Key price levels to watch include the immediate support around $75,000, a level that has acted as a consolidation point in recent weeks, and resistance near $82,000, where selling pressure has previously emerged. A break below $75,000 could shift sentiment toward bearish territory, while sustained trading above $80,000 may reinforce bullish confidence.
Traders are also paying attention to broader market dynamics, including macroeconomic factors and institutional activity, which have historically influenced Bitcoin’s price action. Additionally, on-chain data such as transaction volumes and wallet activity are under scrutiny for insights into investor behavior. For now, the market remains in a state of balance, with participants awaiting clearer directional cues from both technical indicators and external catalysts.
Within its 52-week range of $60,074.20 to $126,198.07, Bitcoin's current price sits comfortably above the lower bound, reflecting sustained strength from earlier gains in the year. Key price levels to watch include the immediate support around $75,000, a level that has acted as a consolidation point in recent weeks, and resistance near $82,000, where selling pressure has previously emerged. A break below $75,000 could shift sentiment toward bearish territory, while sustained trading above $80,000 may reinforce bullish confidence.
Traders are also paying attention to broader market dynamics, including macroeconomic factors and institutional activity, which have historically influenced Bitcoin’s price action. Additionally, on-chain data such as transaction volumes and wallet activity are under scrutiny for insights into investor behavior. For now, the market remains in a state of balance, with participants awaiting clearer directional cues from both technical indicators and external catalysts.
Disclaimer
The content on MarketsFN.com is provided for educational and informational purposes only. It does not constitute financial advice or investment recommendations. All investments involve risk. Cryptocurrency markets are highly volatile. Past performance does not guarantee future results.