Bitcoin Nears $86.5K as RSI Hits 71: Bullish Breakout Ahead?
QuoteReporter
•2 min read
Bitcoin Nears $86.5K as RSI Hits 71: Bullish Breakout Ahead?
Bitcoin (BTC/USD) | October 02, 2026 $86,219.5000 +1.61%
🔍 Technical Analysis
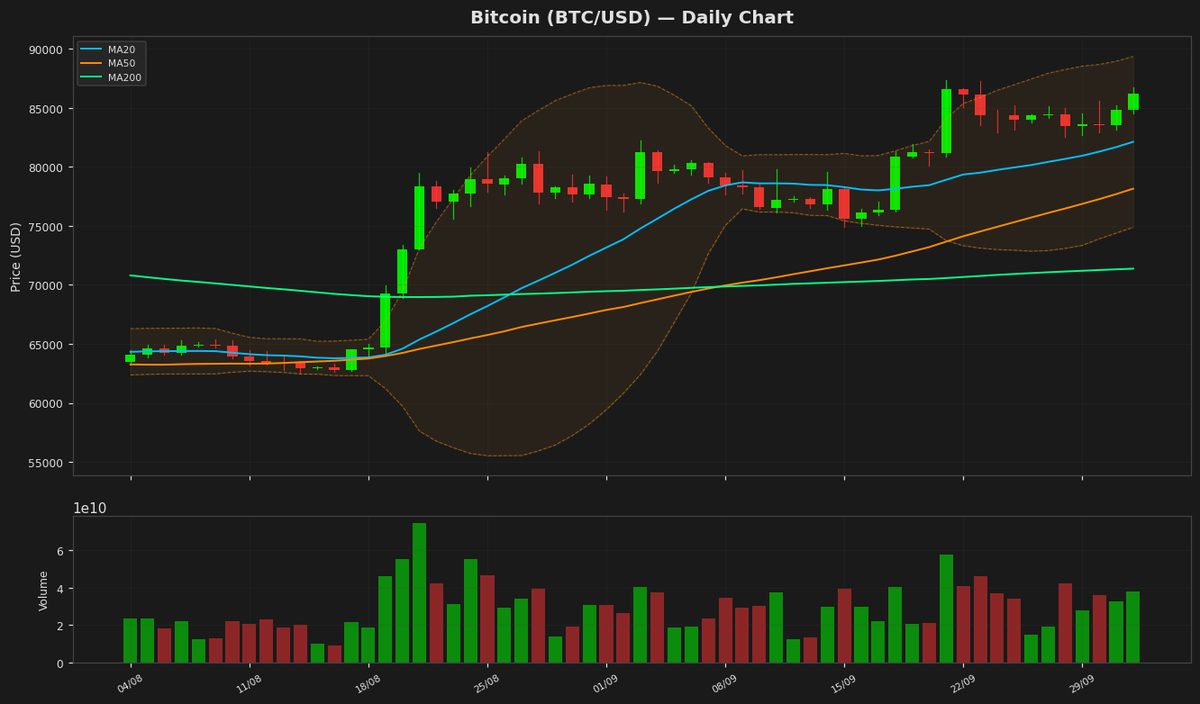
Bitcoin (BTC) is currently trading at $86,219.50, up 1.61% on the day, showing bullish momentum as it holds above key moving averages. The 20-day MA at $82,131.70 and the 50-day MA at $78,157.34 are acting as dynamic support levels, reinforcing the uptrend, while the 200-day MA at $71,379.84 confirms the long-term bullish structure. The Bollinger Bands indicate volatility, with the upper band at $89,372.51 and the lower band at $74,890.89, suggesting potential resistance near the upper band. The RSI at 70.96 is in overbought territory, signaling strong buying pressure but also cautioning of a possible short-term pullback. The MACD at 2128.60 is slightly below its signal line at 2159.53, indicating a potential bearish crossover if the momentum weakens further. Key resistance levels to watch are the YTD high at $97,860.60 and the 52-week high at $90,439.28. On the downside, immediate support lies near the 20-day MA, followed by the 50-day MA. A break below $74,890 (Bollinger lower band) could signal a deeper correction. The ATR at 2222.43 suggests moderate volatility, supporting the current price range. Traders should monitor these levels closely for potential trend reversals or continuations.
Technical Metrics
| Metric | Value |
|---|---|
| Current Price | $86,219.5000 |
| Daily Change | +1.61% |
| MA 20 | $82,131.7055 |
| % from MA20 | +4.98% |
| MA 50 | $78,157.3450 |
| % from MA50 | +10.32% |
| MA 200 | $71,379.8484 |
| % from MA200 | +20.79% |
| BB Upper | $89,372.5183 |
| % from BB Upper | -3.53% |
| BB Lower | $74,890.8926 |
| % from BB Lower | +15.13% |
| RSI (14) | 70.96 |
| MACD | 2128.602489 |
| MACD Signal | 2159.534027 |
| ATR (14) | 2222.434710 |
| 3-Day High | $86,753.9297 |
| 3-Day Low | $82,927.8750 |
| 52-Week High | $90,439.2891 |
| % from 52W High | -4.67% |
| 52-Week Low | $57,747.7656 |
| % from 52W Low | +49.30% |
| YTD High | $97,860.6016 |
| % from YTD High | -11.90% |
| YTD Low | $57,747.7656 |
| % from YTD Low | +49.30% |
📊 Market Commentary
Bitcoin (BTC) is trading at $86,219.50, up 1.61% today, as bullish momentum continues to push the cryptocurrency toward the upper end of its 52-week range ($57,747.77 – $90,439.29). The Relative Strength Index (RSI) at 71.0 indicates BTC is approaching overbought territory, which could signal potential consolidation or a short-term pullback if buying pressure eases. Market sentiment remains optimistic, fueled by institutional interest and broader macroeconomic factors, though traders are cautious given the proximity to the yearly high.
Key resistance levels to watch include the psychological $90,000 mark and the 52-week peak at $90,439.29. A breakout above this level could reinforce bullish sentiment, while failure to sustain upward momentum may lead to a retest of support near $84,000, followed by the $80,000 zone. On-chain data and exchange flows suggest accumulation by long-term holders, but heightened volatility is expected as BTC tests critical price thresholds.
Traders are closely monitoring macroeconomic developments, including central bank policies and inflation trends, which continue to influence risk assets. Additionally, Bitcoin’s correlation with traditional markets and ETF inflows remain focal points. While the current trend favors buyers, the elevated RSI warrants caution, and price action around key levels will likely dictate near-term direction. The market remains balanced between optimism and the potential for profit-taking at higher valuations.
Key resistance levels to watch include the psychological $90,000 mark and the 52-week peak at $90,439.29. A breakout above this level could reinforce bullish sentiment, while failure to sustain upward momentum may lead to a retest of support near $84,000, followed by the $80,000 zone. On-chain data and exchange flows suggest accumulation by long-term holders, but heightened volatility is expected as BTC tests critical price thresholds.
Traders are closely monitoring macroeconomic developments, including central bank policies and inflation trends, which continue to influence risk assets. Additionally, Bitcoin’s correlation with traditional markets and ETF inflows remain focal points. While the current trend favors buyers, the elevated RSI warrants caution, and price action around key levels will likely dictate near-term direction. The market remains balanced between optimism and the potential for profit-taking at higher valuations.
Disclaimer
The content on MarketsFN.com is provided for educational and informational purposes only. It does not constitute financial advice or investment recommendations. All investments involve risk. Cryptocurrency markets are highly volatile. Past performance does not guarantee future results.