Bitcoin Eyes $83K as RSI Hints at Upside Potential
QuoteReporter
•2 min read
Bitcoin (BTC/USD) | October 09, 2026 $82,602.3594 +1.13%
🔍 Technical Analysis
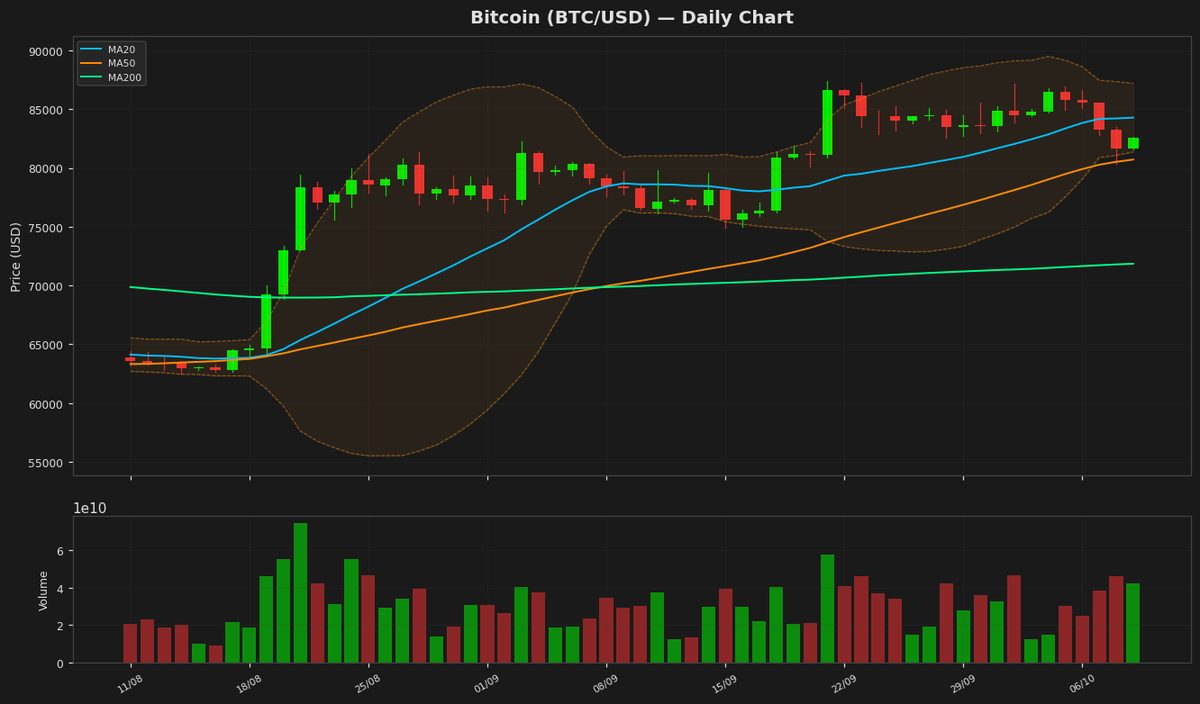
Bitcoin is currently trading at $82,602, showing a modest daily gain of 1.13%. The price remains below the 20-day moving average (MA20) at $84,287, indicating short-term bearish pressure, though it holds above the 50-day (MA50 at $80,719) and 200-day (MA200 at $71,856) moving averages, suggesting a neutral-to-bullish medium-term trend. Bollinger Bands show the price hovering near the lower band ($81,368), signaling potential oversold conditions, while the upper band ($87,206) marks resistance. The RSI at 43.44 is in neutral territory, lacking strong momentum in either direction. The MACD histogram remains negative at -563.54 (MACD line at 1,138.65 vs. signal line at 1,702.19), confirming bearish momentum but showing potential for a reversal if the lines converge. Key support lies at $80,719 (MA50), followed by $77,000, while resistance is found at $84,287 (MA20) and the yearly high at $87,363. A break above $87,363 could target the YTD high of $97,860, whereas a drop below $80,719 may test $77,000. The ATR at 1,932 suggests moderate volatility, requiring caution in near-term positioning.
Technical Metrics
| Metric | Value |
|---|---|
| Current Price | $82,602.3594 |
| Daily Change | +1.13% |
| MA 20 | $84,287.5602 |
| % from MA20 | -2.00% |
| MA 50 | $80,719.6630 |
| % from MA50 | +2.33% |
| MA 200 | $71,856.5751 |
| % from MA200 | +14.95% |
| BB Upper | $87,206.3004 |
| % from BB Upper | -5.28% |
| BB Lower | $81,368.8200 |
| % from BB Lower | +1.52% |
| RSI (14) | 43.45 |
| MACD | 1138.647540 |
| MACD Signal | 1702.187450 |
| ATR (14) | 1932.074219 |
| 3-Day High | $85,594.5469 |
| 3-Day Low | $80,336.9062 |
| 52-Week High | $87,363.7578 |
| % from 52W High | -5.45% |
| 52-Week Low | $57,747.7656 |
| % from 52W Low | +43.04% |
| YTD High | $97,860.6016 |
| % from YTD High | -15.59% |
| YTD Low | $57,747.7656 |
| % from YTD Low | +43.04% |
📊 Market Commentary
Bitcoin (BTC) is currently trading at $82,602.3594, up 1.13% today, as the market shows cautious optimism following recent volatility. The Relative Strength Index (RSI) at 43.4 suggests BTC is neither overbought nor oversold, indicating a neutral momentum phase. Over the past 52 weeks, Bitcoin has ranged between $57,747.7656 and $87,363.7578, with the current price sitting comfortably above the mid-point of this range.
Market sentiment appears mixed, with traders weighing macroeconomic factors such as inflation data and Federal Reserve policy against Bitcoin’s inherent supply dynamics. Institutional interest remains a key driver, as spot Bitcoin ETF flows and institutional accumulation continue to influence price action. On-chain metrics indicate steady accumulation by long-term holders, though short-term traders remain cautious amid fluctuating liquidity conditions.
Key price levels to watch include the psychological resistance near $85,000, which, if broken, could see a retest of the yearly high around $87,364. On the downside, support lies near $80,000, followed by the $77,500 zone, where previous consolidation occurred. A break below this level might trigger further downside toward the 200-day moving average, currently around $70,000.
Traders are also monitoring Bitcoin’s correlation with traditional markets, particularly equities, as risk-on or risk-off sentiment could spill over into crypto. With the RSI neutral and price action consolidating, the market appears to be in a wait-and-see mode, with directional bias likely dependent on broader macroeconomic cues.
Market sentiment appears mixed, with traders weighing macroeconomic factors such as inflation data and Federal Reserve policy against Bitcoin’s inherent supply dynamics. Institutional interest remains a key driver, as spot Bitcoin ETF flows and institutional accumulation continue to influence price action. On-chain metrics indicate steady accumulation by long-term holders, though short-term traders remain cautious amid fluctuating liquidity conditions.
Key price levels to watch include the psychological resistance near $85,000, which, if broken, could see a retest of the yearly high around $87,364. On the downside, support lies near $80,000, followed by the $77,500 zone, where previous consolidation occurred. A break below this level might trigger further downside toward the 200-day moving average, currently around $70,000.
Traders are also monitoring Bitcoin’s correlation with traditional markets, particularly equities, as risk-on or risk-off sentiment could spill over into crypto. With the RSI neutral and price action consolidating, the market appears to be in a wait-and-see mode, with directional bias likely dependent on broader macroeconomic cues.
Disclaimer
The content on MarketsFN.com is provided for educational and informational purposes only. It does not constitute financial advice or investment recommendations. All investments involve risk. Cryptocurrency markets are highly volatile. Past performance does not guarantee future results.