Bitcoin Dips Below $84K as RSI Nears Oversold Zone
QuoteReporter
•3 min read
Bitcoin Dips Below $84K as RSI Nears Oversold Zone
Bitcoin (BTC/USD) | October 07, 2026 $83,954.6016 -1.87%
🔍 Technical Analysis
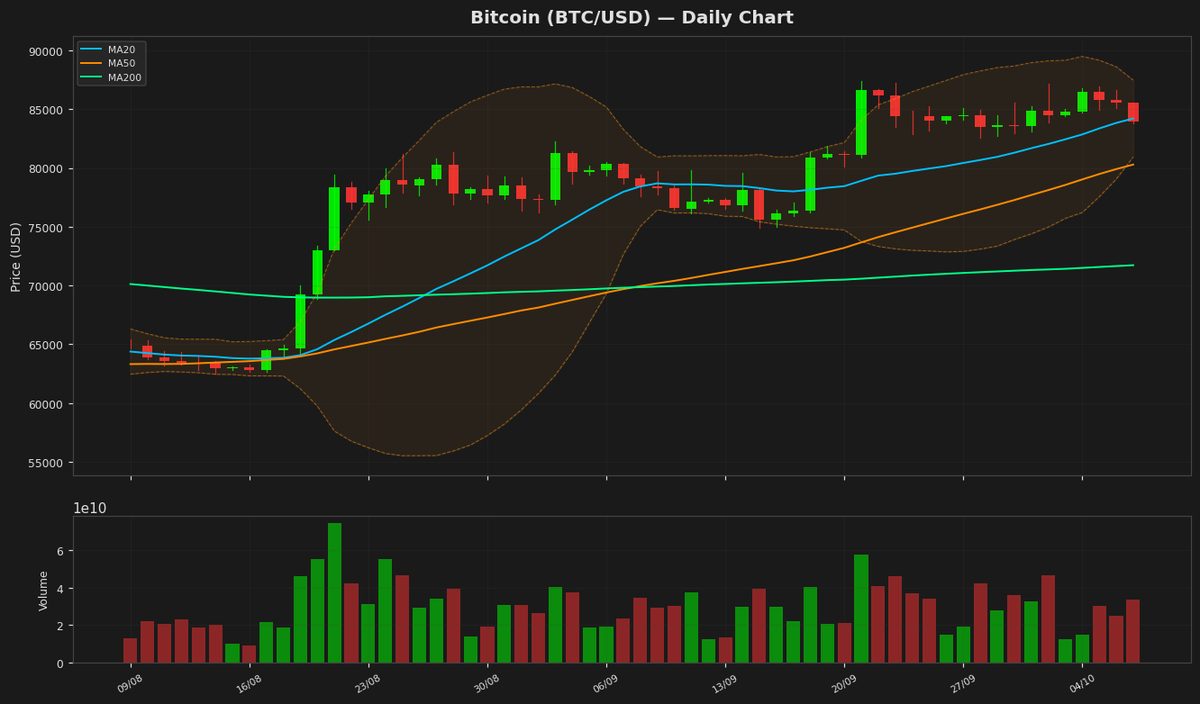
Bitcoin (BTC) is currently trading at $83,954, showing a slight decline of 1.87% on the daily chart. The price remains below the 20-day moving average (MA20) at $84,214, indicating short-term bearish pressure, while staying above the 50-day MA ($80,293) and 200-day MA ($71,732), which suggests underlying bullish support in the medium to long term. The Bollinger Bands reveal a narrowing range, with the upper band at $87,477 and the lower band at $80,951, signaling reduced volatility and a potential breakout in the near future. The RSI at 47.35 is neutral, neither oversold nor overbought, reflecting indecision in the market. The MACD line at 1,743 remains below the signal line at 1,977, indicating bearish momentum, though the histogram shows diminishing downward pressure. Key resistance levels to watch are the recent high at $87,477 (Bollinger upper band) and the 52-week high at $89,200, while immediate support lies at $80,951 (Bollinger lower band) followed by the psychological $80,000 level. A decisive break above $87,500 could reignite bullish momentum, whereas a drop below $80,000 may lead to a test of the 50-day MA. The ATR at 1,848 suggests moderate volatility, reinforcing the need for cautious positioning.
Technical Metrics
| Metric | Value |
|---|---|
| Current Price | $83,954.6016 |
| Daily Change | -1.87% |
| MA 20 | $84,214.3160 |
| % from MA20 | -0.31% |
| MA 50 | $80,293.6414 |
| % from MA50 | +4.56% |
| MA 200 | $71,732.3754 |
| % from MA200 | +17.04% |
| BB Upper | $87,477.4786 |
| % from BB Upper | -4.03% |
| BB Lower | $80,951.1535 |
| % from BB Lower | +3.71% |
| RSI (14) | 47.35 |
| MACD | 1743.341112 |
| MACD Signal | 1977.744235 |
| ATR (14) | 1848.098772 |
| 3-Day High | $86,971.7812 |
| 3-Day Low | $83,802.9375 |
| 52-Week High | $89,200.7812 |
| % from 52W High | -5.88% |
| 52-Week Low | $57,747.7656 |
| % from 52W Low | +45.38% |
| YTD High | $97,860.6016 |
| % from YTD High | -14.21% |
| YTD Low | $57,747.7656 |
| % from YTD Low | +45.38% |
📊 Market Commentary
Bitcoin (BTC) is currently trading at $83,954.60, down 1.87% over the past 24 hours, reflecting a modest pullback after recent gains. The Relative Strength Index (RSI) at 47.3 suggests neutral momentum, indicating neither overbought nor oversold conditions. BTC remains within its 52-week range of $57,747.77 to $89,200.78, with the upper bound acting as a key resistance level that traders are closely monitoring.
Market sentiment appears cautious as Bitcoin consolidates near the higher end of its yearly range. Traders are weighing macroeconomic factors, including inflation expectations and central bank policies, alongside on-chain activity and institutional flows. The $85,000 level has emerged as a short-term psychological barrier, while support is seen around $80,000, a zone that previously held during pullbacks. A break below this level could test deeper support near $77,000, where buying interest has historically strengthened.
Volume trends and ETF inflows remain focal points, as institutional participation continues to influence price action. The market is also attuned to any regulatory developments or macroeconomic shifts that could impact risk assets. With the RSI hovering near mid-range, traders are watching for a decisive move in either direction to gauge the next phase of momentum. For now, Bitcoin appears to be in a consolidation phase, balancing between bullish optimism and near-term profit-taking.
Market sentiment appears cautious as Bitcoin consolidates near the higher end of its yearly range. Traders are weighing macroeconomic factors, including inflation expectations and central bank policies, alongside on-chain activity and institutional flows. The $85,000 level has emerged as a short-term psychological barrier, while support is seen around $80,000, a zone that previously held during pullbacks. A break below this level could test deeper support near $77,000, where buying interest has historically strengthened.
Volume trends and ETF inflows remain focal points, as institutional participation continues to influence price action. The market is also attuned to any regulatory developments or macroeconomic shifts that could impact risk assets. With the RSI hovering near mid-range, traders are watching for a decisive move in either direction to gauge the next phase of momentum. For now, Bitcoin appears to be in a consolidation phase, balancing between bullish optimism and near-term profit-taking.
Disclaimer
The content on MarketsFN.com is provided for educational and informational purposes only. It does not constitute financial advice or investment recommendations. All investments involve risk. Cryptocurrency markets are highly volatile. Past performance does not guarantee future results.