AUD/USD: Up 0.47% to 0.7201 — Ascending Channel
MarketsFN Team
AUD/USD: Up 0.47% to 0.7201 — Ascending Channel
Published: September 03, 2026 · MarketsFN Team · US Session
| Pair | Rate | Change | RSI(14) | SMA-20 | SMA-50 | 52W High | 52W Low | Pivot | R1 | S1 |
|---|---|---|---|---|---|---|---|---|---|---|
| AUD/USD | 0.7201 | +0.47% | 68.2 | 0.7124 | 0.7031 | 0.7256 | 0.6438 | 0.7154 | 0.7188 | 0.7134 |
📊 Support & Resistance Levels
Dynamic Trendlines
| Level | Type | Direction | Distance |
|---|---|---|---|
| 0.7126 | 20d Support | ↗ ascending | -1.03% / 74.1 pips |
| 0.7254 | 20d Resistance | ↗ ascending | +0.74% / 53.6 pips |
| 0.7090 | 50d Support | ↗ ascending | -1.53% / 110.2 pips |
| 0.7233 | 50d Resistance | ↗ ascending | +0.46% / 32.9 pips |
Static Levels
| Level | Type | Touches | Distance |
|---|---|---|---|
| 0.6978 | Support | 2× | -3.09% / 222.2 pips |
| 0.6907 | Support | 2× | -4.08% / 293.6 pips |
| 0.6482 | Support | 2× | -9.99% / 719.0 pips |
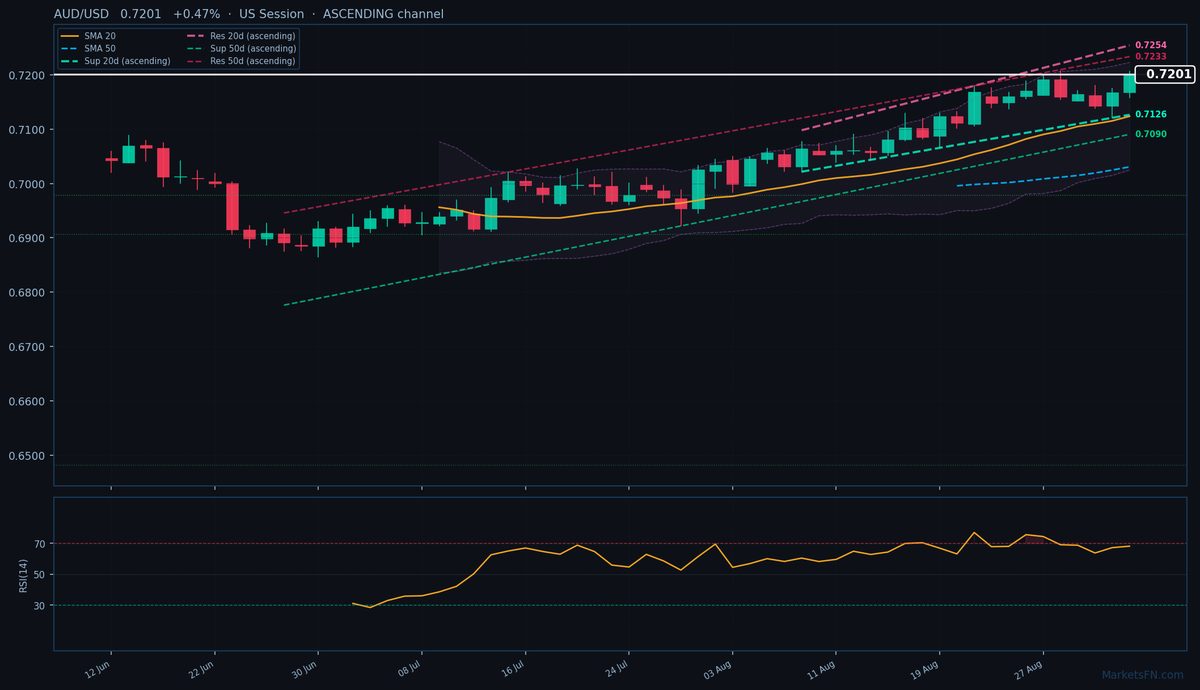
AUD/USD is trading at 0.7201 (+0.47%), extending its bullish momentum as it tests the upper bounds of its ascending 20-day dynamic channel. The pair is now trading above both the 20-day SMA (0.7124) and 50-day SMA (0.7031), confirming the uptrend's structural integrity. The 20-day dynamic resistance trendline sits at 0.7254, just 53.6 pips above current levels, while the 20-day dynamic support trendline at 0.7126 provides a 74.1-pip buffer below. The 50-day channel mirrors this ascent, with resistance at 0.7233 (32.9 pips away) and support at 0.7090 (110.2 pips away).
Static levels show immediate support at S1 (0.7134, 66.7 pips below) and resistance at R1 (0.7188, 13.3 pips above), though the pair has already breached R1 intraday. The RSI at 68.2 remains neutral but leans toward overbought territory, suggesting potential consolidation before another leg higher. With the ATR(14) at 0.0043, today's range of 0.7158–0.7206 aligns with typical volatility.
The short-term outlook favors continued upside toward the 20-day dynamic resistance at 0.7254, though a pullback to test the 20-day SMA (0.7124) or dynamic support (0.7126) wouldn’t invalidate the uptrend. A decisive break above the 52-week high of 0.7256 would confirm bullish continuation, while failure to hold above 0.7188 could trigger profit-taking. Watch US session flows for momentum confirmation.
Disclaimer
The content on MarketsFN.com is provided for educational and informational purposes only and does not constitute financial advice. All investments involve risk and past performance does not guarantee future results.