AUD/USD: Down 0.51% to 0.6948 — RSI Oversold
MarketsFN Team
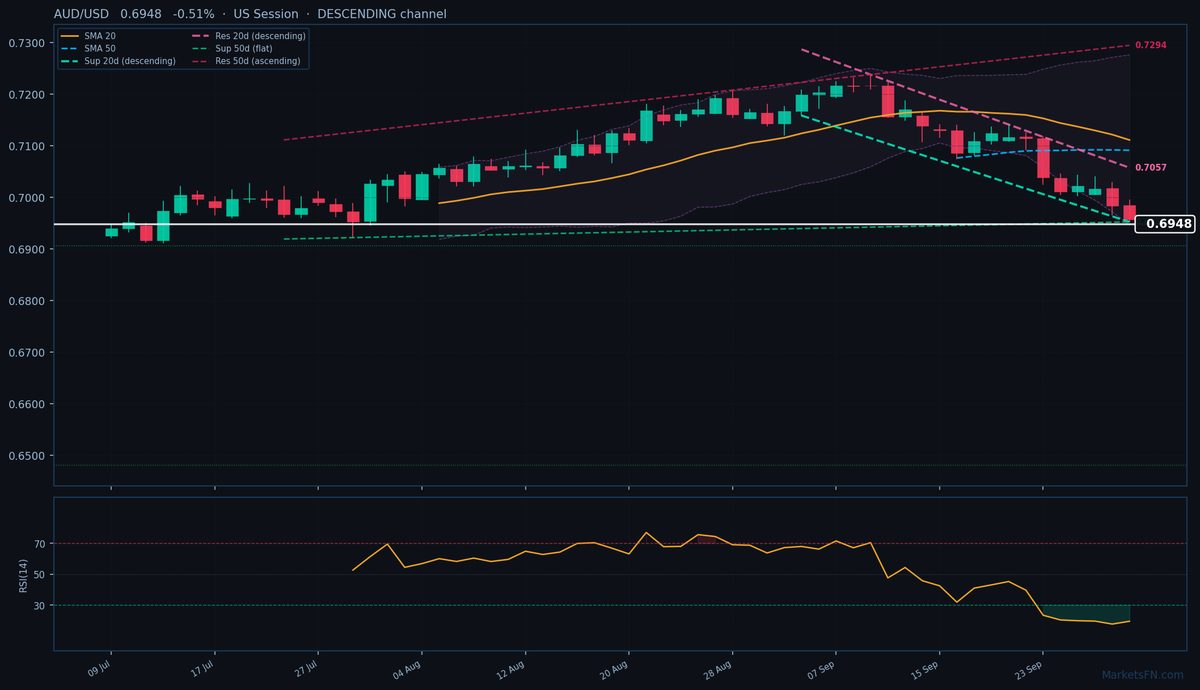
AUD/USD: Down 0.51% to 0.6948 — RSI Oversold
Published: September 30, 2026 · MarketsFN Team · US Session
| Pair | Rate | Change | RSI(14) | SMA-20 | SMA-50 | 52W High | 52W Low | Pivot | R1 | S1 |
|---|---|---|---|---|---|---|---|---|---|---|
| AUD/USD | 0.6948 | -0.51% | 19.4 | 0.7111 | 0.7091 | 0.7256 | 0.6438 | 0.6993 | 0.7020 | 0.6957 |
📊 Support & Resistance Levels
Dynamic Trendlines
| Level | Type | Direction | Distance |
|---|---|---|---|
| 0.6952 | 20d Support | ↘ descending | +0.06% / 4.3 pips |
| 0.7057 | 20d Resistance | ↘ descending | +1.57% / 109.2 pips |
| 0.6952 | 50d Support | → flat | +0.06% / 4.3 pips |
| 0.7294 | 50d Resistance | ↗ ascending | +4.98% / 346.0 pips |
Static Levels
| Level | Type | Touches | Distance |
|---|---|---|---|
| 0.6907 | Support | 2× | -0.72% / 50.3 pips |
| 0.6482 | Support | 2× | -6.84% / 475.7 pips |
AUD/USD is trading at 0.6948 (-0.51%), extending its downtrend as price action remains firmly below both the 20-day (0.7111) and 50-day (0.7091) SMAs, confirming bearish momentum. The pair is probing the lower boundary of its descending 20-day dynamic channel, with immediate support at 0.6952 — just 4.3 pips below current levels — while resistance looms at 0.7057 (109.2 pips above). The 50-day channel paints a conflicting picture, ascending with resistance far overhead at 0.7294 (346.0 pips away), but this broader uptrend is being overshadowed by the near-term bearish structure.
Static levels highlight S1 at 0.6907 (50.3 pips below), which could trigger a bounce if tested, while R1 at 0.7020 (72.0 pips above) aligns with the descending 20-day resistance trendline, creating a confluence barrier. The RSI at 19.4 signals extreme oversold conditions, suggesting potential for a tactical rebound, though the downtrend remains dominant until price reclaims the 20-day SMA. With the ATR(14) at 0.0046, volatility remains elevated, and a break below 0.6952 could accelerate losses toward S1.
Short-term, the pair is vulnerable to further downside unless it stabilizes above the 20-day dynamic support. A close above 0.7020 (R1) would signal bear exhaustion, but until then, sellers control the narrative. Watch US session flows for confirmation of either a breakdown or oversold reversal.
Disclaimer
The content on MarketsFN.com is provided for educational and informational purposes only and does not constitute financial advice. All investments involve risk and past performance does not guarantee future results.