Asian Session Crude Oil Report — 17 Oct 2026
QuoteReporter
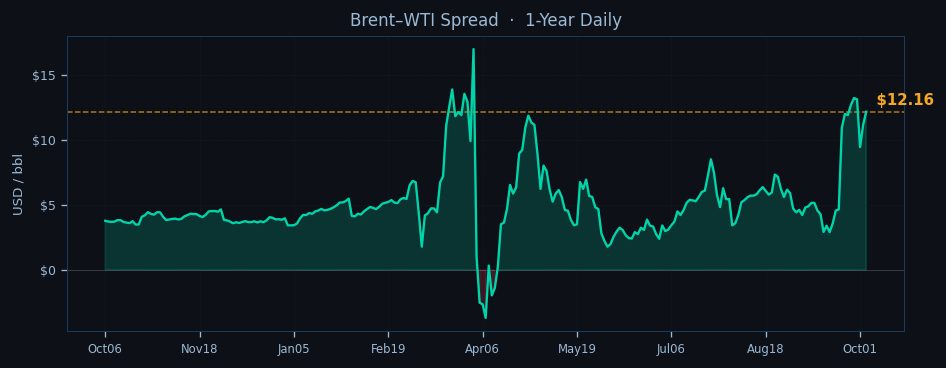
Crude oil markets edge lower in early Asian trading as WTI tests the $90.50 level while Brent holds above $103, with both benchmarks extending their weekly declines amid persistent demand concerns and mixed signals from technical indicators. The Brent-WTI spread remains firm at $12.16 as Atlantic Basin tightness counters softness in US crude stocks. WTI now trades 1.6% below its 9-day EMA at $92.34 while Brent hovers just below its equivalent average at $103.07, with the RSI readings flashing oversold conditions for WTI at 22.5 versus a more neutral 38.9 for Brent.
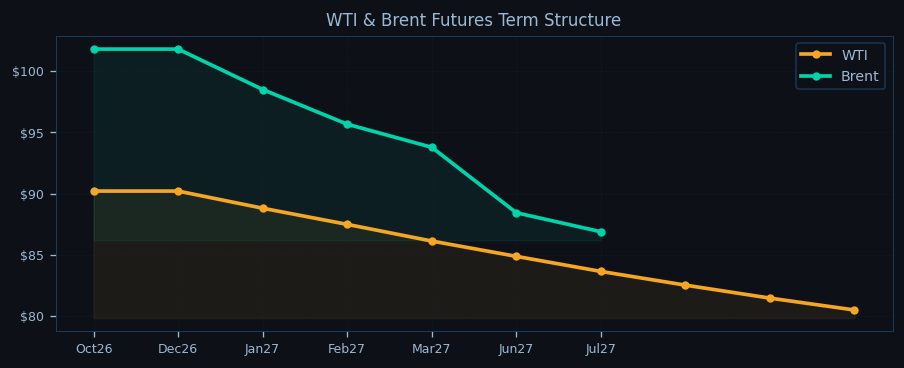
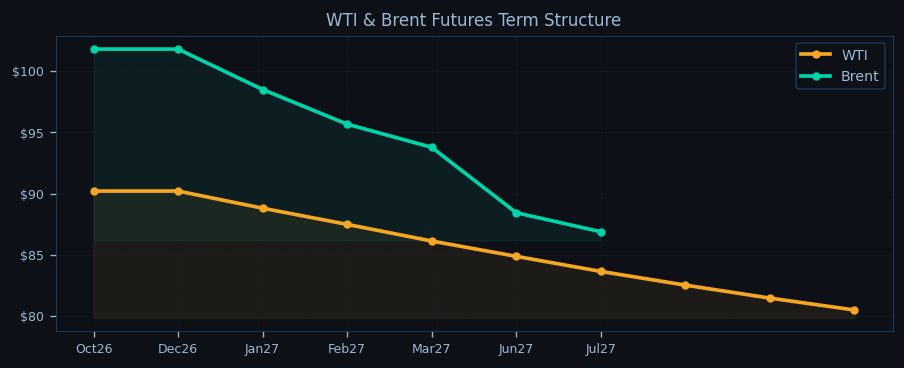
The technical setup shows WTI battling to hold above the pivotal $89.46 level after slipping below all key moving averages, while Brent finds support near its 21-day EMA at $101.63. Downside momentum builds as both contracts test the lower bounds of their 7-day trading ranges, with WTI's steep backwardation of -10.8% between Oct26 and Jul27 contracts contrasting with Brent's even steeper -14.6% structure – a sign of near-term physical tightness despite the broader bearish sentiment. The term structure suggests Asian refiners continue absorbing heavier Middle Eastern grades, with Brent's premium reflecting ongoing disruptions in the Atlantic Basin.

Geopolitical tensions simmer beneath the price action, with Iranian Revolutionary Guard Corps naval activity keeping Hormuz chokepoint risk at ELEVATED status as 20 million barrels per day of flows remain exposed to potential disruption. In the Red Sea, the Bab-el-Mandeb strait warrants WATCH status as Houthi attacks force VLCCs to divert around Africa, adding seven days to voyage times and tightening medium sour crude availability in Europe. OPEC+ discipline shows cracks with Iraq and Russia producing above quota, though Saudi compliance remains absolute as the group maintains cuts through December 2026 against a forecasted 0.6 mb/d quarterly deficit.
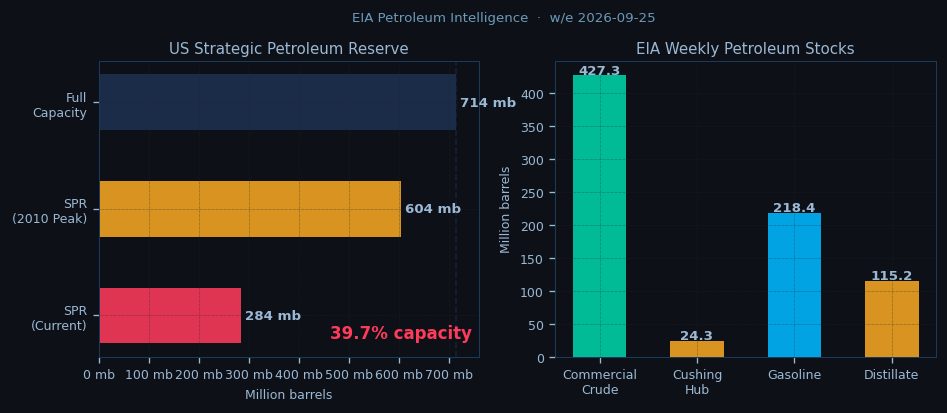
Inventory dynamics paint a mixed picture – US commercial stocks hover at 427.3 million barrels with Cushing working storage at 24.3 million barrels, while refinery runs hold robust at 92.5% utilization. The physical market shows strain as Brent's prompt spread trades in steep backwardation, with October barrels commanding a $1.22 premium to November – a structure that typically indicates immediate supply concerns. Asia-Pacific demand signals flash amber as Chinese crude imports slow seasonally, though regional refining margins remain supportive near $8.50/bbl for Singapore complex runs.
European traders should monitor whether WTI defends the $89.46 pivot point ahead of the London open, with a breach risking a test of $72.17 support. Brent's ability to hold above the $101.63 21-day EMA will prove critical for near-term direction. The spread between Atlantic and Middle East benchmarks warrants attention as VLCC reroutings tighten North Sea and Med supply. All eyes remain on Hormuz transit patterns after sunrise in the Gulf, with any escalation likely to send prompt Brent spreads sharply higher given current tight physical balances. The session's tone may hinge on whether algorithmic traders respect oversold RSI levels or continue driving the liquidation that has erased nearly 4% from both benchmarks this week.

Disclaimer
The content on MarketsFN.com is provided for educational and informational purposes only. It does not constitute financial advice, investment recommendations, or trading guidance. All investments involve risks, and past performance does not guarantee future results. You are solely responsible for your investment decisions and should conduct independent research and consult a qualified financial advisor before acting. MarketsFN.com and its authors are not liable for any losses or damages arising from your use of this information.
Related Articles
- US Session Crude Oil Report — 16 Oct 2026 — WTI crude is trading at $90.86 in the NYMEX session, down 0.27% on the day as it struggles to hold above the…
- European Session Crude Oil Report — 16 Oct 2026 — **European Session Crude Oil Report — 05 Oct 2026 11:00 NY** WTI hovers near $90.86, testing the lower bounds of its…
- US Session Crude Oil Report — 15 Oct 2026 — WTI crude is trading at $90.86 in early New York session action, holding just above the pivotal $89.46 support as Brent…
- European Session Crude Oil Report — 15 Oct 2026 — **European Session Crude Oil Report – 05 Oct 2026 (11:00 NY)** Crude markets hold steady in early European trade with…
- Asian Session Crude Oil Report — 15 Oct 2026 — WTI crude is trading at $90.86 in early Asian hours, holding near overnight lows as the contract extends its seven-day…